College Algebra Graded Homework #6
Show your work on notebook paper. Record the final
answers onto this sheet.
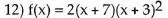
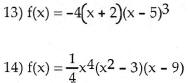
Determine whether the function is a polynomial function . (Write YES or NO)
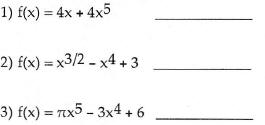
Find the degree of the polynomial function .
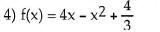 f(x) is degree
Find the x- intercepts of the polynomial function. State whether the graph
crosses the x-axis, or touches the x-axis and
turns around, at each intercept.

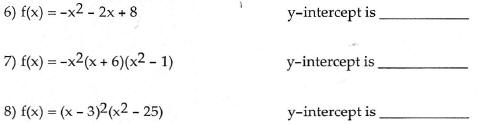
Find the y- intercept of the polynomial function.
Use the Leading Coefficient Test to determine the end behavior of the
polynomial function. (You can explain the end
behavior in words or draw a "picture box" illustrating the behavior at the
ends.)
11) A herd of moose is introduced to a wildlife refuge. The number of moose , N(t),
after t years is described by the
polynomial function 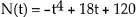 . Use the Leading
Coefficient Test to determine the graph's end
. Use the Leading
Coefficient Test to determine the graph's end
behavior. Write a sentence to explain what this means about what will eventually
happen to the moose
population?
Find the zeros of the polynomial function.
Find the zeros for the polynomial function and give the
multiplicity for each zero . State whether the graph crosses the
x-axis or touches the x-axis and turns around, at each zero.
Write the equation of a polynomial function with the
given characteristics. Use a leading coefficient of 1 or -1 and make
the degree of the function as small as possible.
15) Crosses the x-axis at -4, 0, and 1; lies above the x-axis between -4 and 0;
lies below the x-axis between 0 and 1.
16) Suppose that a polynomial function is used to model the data shown in the graph below .
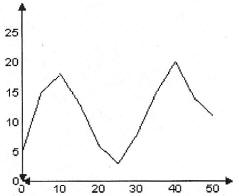
Determine the degree of the polynomial function of best
fit and the sign of the leading coefficient.
The polynomial will be  degree with a
lead coefficient.
degree with a
lead coefficient.
17) The profits (in millions) for a company for 8 years were as follows:
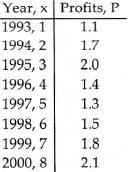
Which of the following polynomials is the best model for this data?

Graph the polynomial function. Be sure to put an
appropriate scale on the graph. Label the x-intercepts and the
y-intercept.
Complete the following:
(a) Use the Leading Coefficient Test to determine the graph's end behavior.
(b) Find the x-intercepts. State whether the graph crosses the x-axis or touches
the x-axis and turns around at each
intercept.
(c) Find the y-intercept.
(d) Graph the function.
Divide using long division.

Divide using synthetic division .

Use synthetic division and the Remainder Theorem to find the indicated function value .

Use synthetic division to show that the number given to
the right of the equation is a solution of the equation , then solve
the polynomial equation.

The solutions are
![]()
Use the graph or table to determine a solution of the equation. Use synthetic
division to verify that this number is a
solution of the equation. Then solve the polynomial equation.
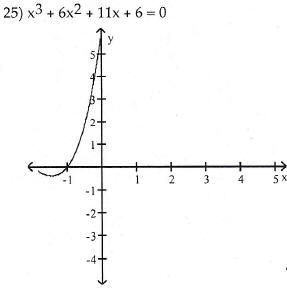
The solution(s) to the polynomial are
![]()
| Prev | Next |