Graphing Linear Inequalities
AIM: SWBAT graph a system of linear
inequalities on the coordinate plane
DO NOW:
Find the slope & y- intercept :

HW:
P. 434#8, 9, 10,12
Assessment Packet DUE MONDAY!!!
EXAM MONDAY!!!
10.8 GRAPHING LINEAR INEQUALITIES
Example:
You will graph these just like lines :
- Put it in STANDARD FORM 
- Find the SLOPE and Y -INT.
- Use the y-int. as 1st point and move to the next
- points using the slope
What’s different about them ?
| - If inequality has < , > } |  |
| - If inequality has < , > } |  |
- SHADING (just like regular inequalities:
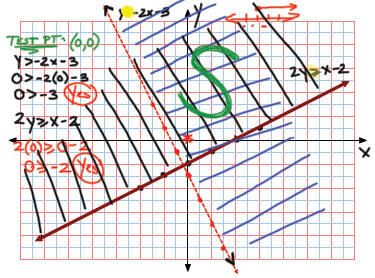
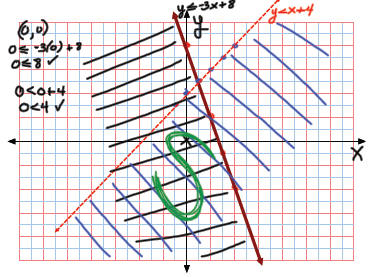
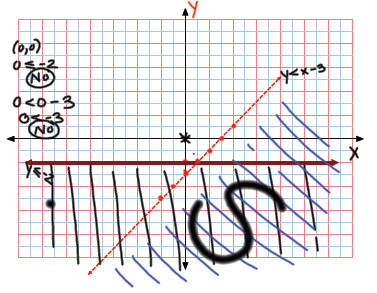
A) Pick a TEST POINT on either side of
the line (0,0) is the best when available
B) Plug it into the inequality to de termine if
it is a solution or not
 If yes, you shade IN
THE DIRECTION
If yes, you shade IN
THE DIRECTION
OF THE TEST POINT
 If no, you shade IN
THE OPPOSITE
If no, you shade IN
THE OPPOSITE
DIRECTION OF THE TEST POINT
The solution, labeled as “S” is where the 2 shadings
overlap!!
Ex:
Ex:
| Prev | Next |
