Math Final Review
Highlights from Chapters 1 & 2:
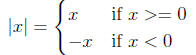
Absolute value
Simplification:
exponent rules (cf log rules )
taking roots
 (or
simplifying any even power)
(or
simplifying any even power)
there are still two solutions to the problem
However, it is wrong to say
 consider
x = −8
consider
x = −8
it is painfully wrong to say
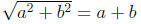
unless you know one of a or b is equal to 0.
combining rational expressions (getting common denominators )
compound fractions (simplifying fractions within fractions)
rationalizing denominators and numerators
Factoring:
difference of squares x^2 − y^2 = (x + y)(x − y)
sum of cubes x^3 + y^3 = (x + y)(x^2 − xy + y^2)
difference of cubes x^3 − y^3 = (x − y)(x^2 + xy + y^2)
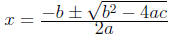
quadratic equation, solutions to ax^2 + bx + c = 0 for non-zero a are:
completing the square
get 0 on one side and factor
if f(x)h(x) = 0 then f(x) = 0 or h(x) = 0
this is not true with vectors
equations of quadratic type
extraneous roots:
may be created when
multiplying both sides of an equation to clear denominators
raising both sides of an equation to an even exponent
clearing logs with exponentials
if you do any of these things you must check your answers
Inequalities:
interval notation sign diagrams
properties p. 85
Distance between point
 is
is

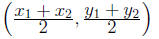
Midpoint formula for P 1 and P2 is
Graphs of equations:
find your x and y intercepts, plot them especially when they are nice
x-intercept = when your function hits the x-axis = root = zero = when y is zero
y-intercept = when your function hist the y-axis = when x is zero
symmetry with respect to x-axis, y-axis, origin
you may want to think about this for the conics which we have recently been
discussing.
Lines:
slope
perpendicular, parallel
Functions
Definition: a function f assigns to each x in its domain a unique y in its range
(each x gets assigned to one, and only one y value)
evaluation
graph (this is where you might apply the vertical line test)
domain, range
Graphs of Functions:
even f(−x) = f(x)
odd f(−x) = −f(x)
how does this correspond to symmetry
shifting, vertical and horizontal stretches, reflecting
Introductory parabola material
How does this compare to our new view of parabloas?
Standard form
Vertex (max/min)
add, multiply, divide
how does this change the domain?
Composition of functions
domain
Chapter 3
3.1
Intermediate Value Theorem: If f is a polynomial function and f(a) ≠ f(b) for a≤b,
then f takes
on every value between f(a) and f(b) in the interval [a, b].
Sketch the graph of a function from its sign chart.
Find the sign chart from the (factored) equation of a function.
3.2 Polynomial Long division
Division algorithm : If f(x) and p(x) are polynomials and if p(x)
≠ 0, then
there exist unique
polynomials q(x) and r(x) such that f(x) = p(x) · q(x) + r(x). Where r(x) = 0 or
the degree of r(x)
is less than the degree of p(x).
Remainder Thm: If a polynomial f(x) is divided by x − c, then the remainder is f(c).
Factor Thm: A polynomial f(x) has a factor x − c if and only if f(c) = 0.
3.5 Rational Functions
domain
vertical asymptotes
horizontal asymptote
oblique asymptote
hole
sketching the graph
finding an equation given the graph
3.6 Variation
direct (write xαy for “x is directly proportional to
y ”)
inverse
Chapter 4
4.1 Inverse Functions
Definition of 1-1
Horizontal line test
Theorem on Inverse Functions: Let f be a one-to-one function with domain D and
range R. If g is
a function with domain R and range D, then g is the inverse function of f if and
only if both of the
following conditions are true: (1) g(f(x)) = x for every x in D, and (2) f(g(y))
= y for every y in R.
domain of f−1 = range of f, and range of f−1 = domain of f
graph of f−1 is a reflection of the graph of f through the line y = x
4.2 Exponential functions:
if the base is greater than 1, the graph is increasing
if the base is less than 1 (but greater than 0), the graph is decreasing
either way the y intercept is 1 (a0 = 1 for any base a)
Note: we do not consider 0, 1, or negative numbers as bases.
Exponential funcitons are 1-1
Solve exponential equations using 1-1
Sketch graphs of exponentials, shifting, multiplying by a constant
compound interest
4.3 Natural Exponential Function
continuously compounded interest
growth/decay
sketch graph
finding zeros
4.4 Logarithms
y = logax if and only if x = ay
Note: this means that logau is the inverse function of ay
converting between logs and exponentials
evaluating logs
solving log equations
sketching graphs
common log is log10
natural log is loge(denoted ln)
4.5
Properties of Logarithms:
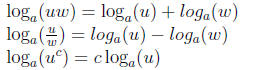
proofs of above properties (using the definition and corresponding properties
for exponents)
Note: there is not a convenient way to break up loga(u + v)
applying these rules solving equations with logs more graphing
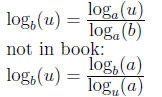
4.6 Change of base formulas
Chapter 5
5.1 Angles
initial side, terminal side, vertex
coterminal angles
standard position
counterclockwise = positive
clockwise = negative
quadrants
finding coterminal, complementary, supplementary angles
acute, obtuse
radians (convert from degrees to radians and radians to degrees
180º = π
radians
length of a circular arc: s = rθ
area of a circular sector:

5.2
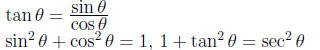
Trig functions

reciprocal identities
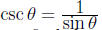 etc.
etc.
given one trig function, find the values of the others
trig functions for 30º
, 40º
and 60º (chart on p 375)
expressing one trig function in terms of another one
showing an equation is an identity
5.3
extend trig functions to all of the unit circle, not just triangles
signs of each trig function in the different quadrants
trig functions of multiples of π/2
range, domain, even/odd symmetry, y-intercept, x-intercepts
graphs (these are all periodic functions)
using a graph to find solutions to an equation
5.4
reference angles
exact values
5.5 & 5.6
graphing: change period, amplitude, phase shift, vertical shift
if y = a sin(bx + c) + d the amplitude is |a| the period is
 and the phase shift is −c/b
finding, amplitutde, phase shift, period from a function
cosine, tangent, cotangent, secant and cosecant as well
5.7
given some information about a right triangle, solve for the rest of the
information.
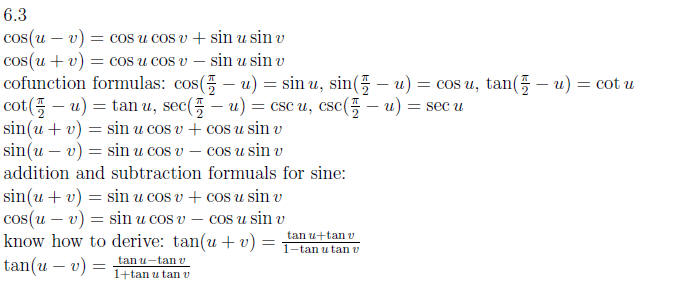
Chapter 6
6.1 Verifying Trig Identities
you may work with both sides of an equation, however you may not multiply both
sides by a variable
expression.
recall that to show something is not an identity, it is enough to find one
number for which the two
sides are unequal.
6.2 Trigonometric Equations
using multiple angle formulas
set equal to 0, factor
find all solutions
find solutions in an interval
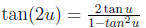
6.4
Double Angle Formulas:
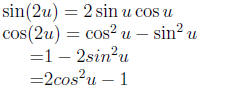
Note: this should help you remember the sign of cos(u + v) because it is not
true that cos(2u) = 1
for all u.
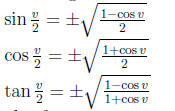
Half-Angle Identities:
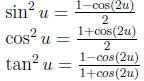
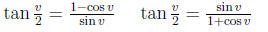
Half-Angle Formulas:
also for tangent:
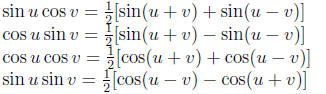
6.5
Product to sum formulas:
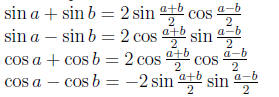
Sum to product formualas:
6.6 Inverse trig functions
summary of relationships between f and f−1 on p510
y = arcsin(x) if and only if x = sin(y) for
Domain:
 Range:
so sin(arcsin(x)) = x
if x is outside this range, this is undefined
also arcsin(sin(y)) = y if
if y is outside this range it is never a value of arcsin (arcsin(sin(y)) is still defined)
y = arccos(x) if and only if x = cos(y) for

y = arctan(x) if and only if x = tan(y) for any real number x and
note the domain must be restricted in order to define the inverse functions.
evaluating (sum forumalas)
changing into an algebraic expression
solving equations
finding an inverse function
Chapter 7
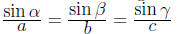
7.1 Law of Sines
if ABC is a triangle laveled in the usual manner then
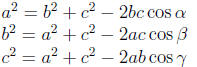
7.2 Law of Cosines
The area of a triangle is one-half the product of the lengths of any two
sides multiplied by the sine
of the angle between them.
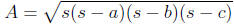
Heron’s Formula: the area A of a triangle with sides a, b, and c is given by:
 where
s is one-half the perimeter:
where
s is one-half the perimeter: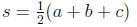
7.3 Vectors
directed line segment (inital and final points)
magnitude (length of that line segment)
direction (angle, initial to final)
addition: place initial point of one vector on the final point of the other.
doing this in two ways creates a parolleogram whose diagonal is the vector
representing the sum
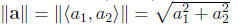
a position vector

inital point at origin, final point at

magnitude is therefore:
addition:

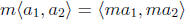
multiplication by a scalar:
 the zero vector is

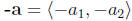 this is the same as multiplying by −1
properties of vectors: see page 555
Definition of i (not to be confused with imaginary i) and j
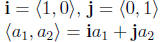
unit vectors have magnitude 1
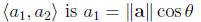
horizontal component of
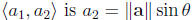
vertical component of
7.4 The Dot Product

this is a real number, not a vector
properties of dot product p. 566
vectors are parallel if the angle between them is 0 or π
they are orthogonal if the angle between them is π/2
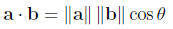
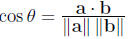
so if θ is the angle between two nonzero vectors a
and b then
two vectors are orthogonal if and only if a · b = 0
Chater 8
8.1 & 8.2 Systems of equations
If you have two equations in two variables (say x and y), to use the method of
substitution :
-solve for one variable (for example x) in terms of the other (here y)
you now have something that reads x = f(y) where f(y) is just some expression
involving y.
-substitute that expression in your other equation
you should now have an equation involving only the one variable (y in our
example)
-solve that equation (for y)
-for each value of y produced, use the original expression (x = f(y)) to get a
value for x
-check each pair of solutions (x, y)
if you have more variables and more equations, it is possible to modify this
process
If you have a system of linear equations you may want to change it into an
equivalent system by:
-interchanging two equations
-multiplying an equation by a non-zero constant
(equivalently dividing by a non-zero constant)
-adding a constant multiple of one equation to another
in this case you must multiply each term of the equation (on both sides of =) by
the same constant
The types of systems of linear equations we discussed are:
Nonparallel lines = one solution = “consistent system”
Identical lines = infinite number of solutions = “dependent and consistent
system”
Note: this does not mean all pairs (x,y) satisfy the system
Parallel lines = No solution = “inconsistent system”
Chapter 10
10.1 Parabolas
introduction to conic sections
a parabola is the set of points in the plane equidistant from a fixed point
(focus) and a fixed line
(directrix)
the vertex is the point halfway between the focus and directrix
the axis is the line running through the vertex and focus
Note: a parabola is symmetric with respect to its axis
If the axis of a parabola is vertical, the equation is:
(x − h)^2 = 4p(y − k) where the vertex is (h, k) the focus is (h, k + p) the
directrix is y = k − p
if p is positive the parabola opens up, if p is negative it opens down.
If the axis of a parabola is horizontal, the equation is:
(y − k)^2 = 4p(x − h) where the vertex is (h, k) the focus is (h + p, k) the
directrix is y = h − p
if p is positive the parabola opens right, if p is negative it opens left.
you should be able to go between graphs, equations, focus/vertex/directrix
that is, given some little information you can produce the rest
10.2 Ellipses
an Ellipse: the set of points (P), the sum of whose distances from two fixed
points (foci F1, F2) is a
positive constant d(P, F1) + d(P, F2) = c
the center of the ellipse is the midpoint between the foci
the major axis is the line through the foci
the minor axis is the line
 major axis which goes through the center point
the vertices are the points furthest from the center (where the major axis hits
the ellipse)
Note: an ellipse is symmetric with respect to its major axis, minor axis, and
center point
If the major axis of an ellipse is horizontal, its equation is:
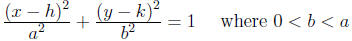
its center is at (h, k), its foci are a distance c from
the center (in the x-direction) where c^2 = a^2 − b^2
the length of the major axis is 2a, the length of the minor axis is 2b
accordingly, the vertices are at (h + a, k) and (h − a, k)
If the major axis of an ellipse is vertical, its equation is:
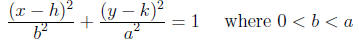
its center is at (h, k), its foci are a distance c from
the center (in the y-direction) where c^2 = a^2 − b^2
the length of the major axis is 2a, the length of the minor axis is 2b
accordingly, the vertices are at (h, k + a) and (h, k − a)
again, you should be able to go between graphs, equations,
foci/vertices/major axis/minor axis/center
that is, given some little information you can produce the rest
10.3 Hyperbolas
a Hyperbola: the set of points (P), the difference of whose distances from two
fixed points (foci F1,
F2) is a positive constant so d(P, F1) − d(P, F2)
= c or d(P, F2) − d(P, F1) = c.
the center of the hyperbola is the midpoint between the foci
the transverse axis is the line through the foci
the conjugate axis is the line
transverse axis which goes through the center point
the vertices of the hyperbola are the points closest to the center (where the
transverse axis hits the
hyperbola)
Note: a hyperbola is symmetric with respect to its transverse axis, conjugate
axis and center
If the transverse axis of a hyperbola is horizontal, its equation is:
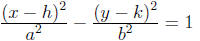
its center is at (h, k), its foci are a distance c from
the center (in the x-direction) where c^2 = a^2 + b^2
the length of the transverse axis is 2a, the length of the conjugate axis is 2b
accordingly, the vertices are at (h + a, k) and (h − a, k)
the equations for its asympototes are 
If the transverse axis of a hyperbola is vertical, its equation is:
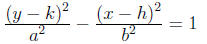
its center is at (h, k), its foci are a distance c from
the center (in the y-direction) where c^2 = a^2 + b^2
the length of the transverse axis is 2a, the length of the conjugate axis is 2b
accordingly, the vertices are at (h, k + a) and (h, k − a)
the equations for its asympototes are 
| Prev | Next |