Statistics for Sociologists
Goals of This Module
• Start with a discussion of looking at simple
relationships
between categorical dependent and independent variables
• Converting to proportions , percentages and ratios
• Contingency tables (cross-tabulation)
• Partial tables for multivariate relationships
• Problem of Simpson’s Paradox
• Revisit multiple regression , considering categorical
explanatory variables (dummy variables)
• Look at both main effects ( difference in intercepts ) and
interaction effects ( difference in slopes )
• Question of causation
• Establishing causation
Converting Raw Numbers to Proportions , Percentages or
Ratios
• Raw numbers (i.e, simply the number of cases in a
particular
category) can often be difficult to interpret, especially if there
are several categories and an awkward number of total cases
• Percentages and proportions (and ratios) are also much easier
to compare both with variables and across variables
• Cautions:
• We must be careful not to over-interpret percentages (or
proportions) based on small total sample sizes
• Tables containing proportions or percentages should always
contain the sample size (n)
Proportions
• It is often useful to convert raw numbers to
proportions,
especially when comparing categories
• The formula to find a proportion is simply:
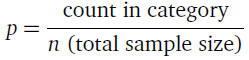
• If there are 60 students in the class, 46 of whom are
women,
what is the proportion of women? Here count = 46 and
n = 60, therefore
p = 46/60 = .77
• In other words, the proportion of women in the class is
.77.
• Since the total equals 1, the proportion of men is 1-.77 = .23
Percentages
• A percentage gives us the same information as a
proportion
except we now multiply the proportion by 100:
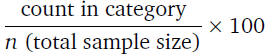
• Continuing from the proportions example, if there are 60
students in the class, 46 of whom are women, what is the
percentage of women? Here count = 46 and n = 60,
therefore
p = (46/60)*100 = 77%
• In other words, 77% of the class are women
• Since the total for percentages equals 100, the percentage of
men is 100-77 = 23%
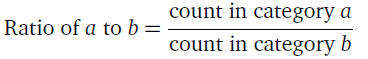
Ratios
• Ratios allow us to directly compare the relative number
of
cases in one category compared to another:
• If there are 46 women and 14 men, the ratio of women to
men is:
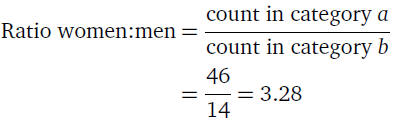
• In other words, there are more than 3 times as many
women
as men in the class
Bar Graphs and Pie Charts revisited (1)
Bar charts should be used over pie charts – research
indicates
that people are better able to judge the relative difference in
size of straight lines than pie shapes
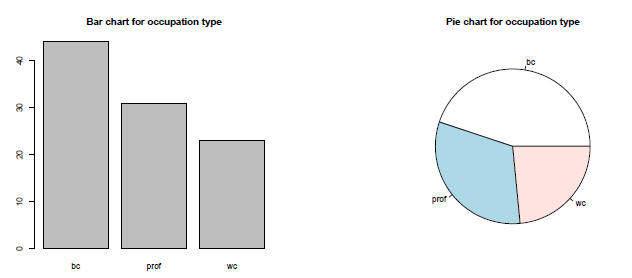
> plot (type, main="Bar chart for occupation type")
> pie(table(type), main="Pie chart for occupation type")
Bar Graphs and Pie Charts revisited (2)
An Alternative to the Bar graph & Pie Chart: the Dot Chart
• The dot chart is an
alternative to the bar graph
or pie chart. It is especially
useful for displying
multivariate tables (see
later)
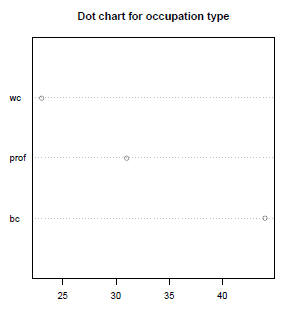
> par(pty="s")
> dotchart(table(type), main="Dot chart for occupation type")
Bar Graphs and Pie Charts revisited (3)
Critique of pie chart by Cleveland (1994, Figures 4.19 p. 262 and 4.20 p. 263)
Contingency Tables
• Also called Cross-Tabulations
• Display relationships between categorical variables
• Remember: With qualitative variables we talk of relationships
or associations, but NOT correlations.
• Cells of the table represent the number of observations that
fall simultaneously into a particular combination of two
categories of the two variables .
• Tables can be presented in several ways:
1. Raw counts or frequencies
2. Percentages (or proportions) of total N
3. Percentages (or proportions) of column Ns
4. Percentages (or proportions) of row Ns
| Prev | Next |