Rectangular Coordinate System
After studying this section, you will be able to:
1. Plot a point, given the coordinates.
2. Name the coordinates of a plotted point.
3. Find ordered pairs for a given linear equation.
Plotting a Point
Many things in everyday life are clearer if we see a picture. Similarly, in mathematics, we can picture algebraic relationships by drawing a graph. To draw a graph, we need a frame of reference.
In earlier tutorial we showed that any real number can be represented on a number line. Look at the number line below. The arrow indicates the positive direction.

To form a rectangular coordinate system, we draw a second number line vertically. We construct it so that the 0 point on each number line is exactly at the same place. We refer to this location as the origin. The horizontal number line is often called the x-axis. The vertical number line is often called the y-axis. Arrows show the positive direction for each axis.

We can represent a point in this rectangular coordinate system by using an ordered pair of numbers. The first number of the pair represents the distance from the origin measured along the horizontal or x-axis. The second number of the pair represents the distance measured on the y-axis or on a line parallel to the y-axis. For example (5, 2) is an ordered pair that represents a point in the rectangular coordinate system.
The ordered pair of numbers that represent a point are often referred to as the
coordinates of a point. The first value is called the x-coordinate. The second value is called the y-coordinate. If the x-coordinate is positive, we count the proper number of squares to the right (in the positive direction). If the x coordinate is negative, we count to the left. If the y-coordinate is positive, we count the proper number of squares upward (in the positive direction). If the y coordinate is negative, we count downward.

EXAMPLE 1 Plot the point (5, 2) on a rectangular coordinate system. Label this as point A.
Since the x-coordinate is 5, we first count 5 units to the right on the x axis. Then, because the y-coordinate is 2, we count 2 units up from the point where we stopped on the x-axis. This locates the point corresponding to (5, 2). We label this point A.

It is important to remember that the first number in an ordered pair is the x-coordinate, and the second number is the y-coordinate. The points represented by (5, 2) and (2,5) are totally different, as we shall see in the next example.
EXAMPLE 2 Plot the point (2,5) on a rectangular coordinate system.
We count 2 units to the right for the x value of the point. Then we count 5 units upward for the y value of the point. We draw a dot and label it C at the location of the ordered pair (2, 5).
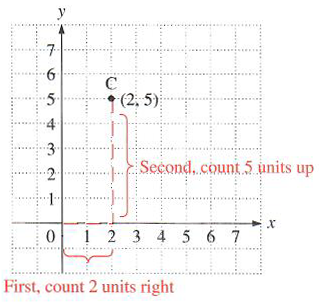
We observe that point C (2,5) is in a very different location from point A (5,2) in Example 1.
EXAMPLE 3 Plot the following points.
F : (0,5) G : (3, 3/2) H : (-6, 4) I : (-3, -4) J : (-4, 0) K : (2, -3) L : (6.5, -7.2)
These points are plotted in the figure.

Note: When you are plotting decimal values like (6.5, -7.2), put the location of the plotted point halfway between 6 and 7 for the 6.5 and at your best approximation in the y-direction for the -7.2.
Determining the Coordinates of a Plotted Point
Sometimes, we need to find the coordinates of a point that has been plotted. First, we count the units we need on the x-axis to get as close as possible to that point. Next we count the units up or down we need to go from the x-axis to finally reach that point.
EXAMPLE 4 What ordered pair of numbers represents the point A in the figure below?

We see that the point A is represented by the ordered pair (5,4). We first counted 5 units to the right of the origin on the x-axis. Thus we obtain 5 as the first number of the ordered pair. Then we counted 4 units upward on a line parallel to the y-axis. Thus we obtain 4 as the second number on the ordered pair.
EXAMPLE 5 Write the coordinates of each point plotted below.

The coordinates of each point are:
E = (5, 1) F=(3,-4) G=(0,-6) H=(-2,-2)
I = (-5,0) J=(-2,2) K=(1,5)
Be very careful that you put the x-coordinate first and the y-coordinate second. Be careful that each sign is correct.
Finding Ordered Pairs for a Given Linear Equation
Equations such as 3x + 2y = 5 and 6x + y = 3 are called linear equations in two variables. A linear equation in two variables is an equation that can be written in the form Ax + By = C where A, B, and C are real numbers but A and B cannot both be zero. Replacement values for x and y that make true mathematical statements of the equation are called truth values and an ordered pair of these truth values is called a solution.
Consider the equation 3x + 2y = 5. The ordered pair (1, 1) is a solution to the equation. When we replace x by 1 and y by 1 we obtain a true statement.
3(1) +2(1) =5 or 3+2=5
There are an infinite number of solutions, for any given linear equation in two variables.
We obtain ordered pairs from examining such a linear equation. If one value of an ordered pair is known, the other can be quickly obtained. To do so, we replace one variable in the linear equation by the known value. Then using the methods learned in previous lesson we solve the resulting equation for the other variable.
EXAMPLE 6 Find the missing coordinate to complete the following ordered pairs for
the equation 2x + 3y = 15.
(a) (0, ?) (b) (?, 1)
(a) In the ordered pair (0, ?) we know that x = 0. Replace x by 0 in the equation.
2x + 3y = 15
2(0)+3y=15
0+ 3y = 15
y=5
Thus we have the ordered pair (0, 5).
(b) In the ordered pair ( ? , 1), we do not know the value of x. However, we do know that y = 1. So we start by replacing the variable y by 1. We will end up with an equation with one variable x. We can then solve for x.
2x + 3y = 15
2x + 3(1) = 15
2x+3= 15
2x = 12
x=6
Thus we have the ordered pair (6, 1).
The linear equations that we work with are not always written in the form Ax + By = C but are sometimes solved for y as in y = -6x + 3. Consider the equation y = -6x + 3. The ordered pair (2, -9) is a solution to the equation. When we replace x by 2 and y by -9 we obtain a true mathematical statement:
(-9) = -6(2) + 3 or -9 = -12 + 3.
EXAMPLE 7 Find the missing coordinate to complete the following ordered pairs for the equation y = -3x + 4
(a) (2, ?) (b) (-3, ? )
(a) For the ordered pair (2, ?) we know that x is 2, so we replace x by 2 in the equation and solve for y.
y= -3x+4
y=-3(2)+4
y=-6+4
y=-2
Check your answers.
y = -3x + 4
(-2)=-3(2)+4
-2=-6+4 ✔
Thus, the solution is the complete ordered pair (2, -2).
(b) For the ordered pair (-3, ?) we replace x by -3 in the equation.
y=-3x+4
y=-3(-3)+4)
y=9+4
y= 13
Check.
y= -3x+ 4
13=-3(-3)+4
13=9+4 ✔
Thus, the solution is the ordered pair (-3, 13).
Graphing Linear Equations
After studying this section, you will be able to:
1. Graph a straight line by finding three ordered pairs that are solutions to the linear equation.
2. Graph a straight line by finding its x- and y-intercepts.
3. Graph horizontal and vertical lines.
Graphing a Linear Equation by Plotting Three Ordered Pairs
We have seen that the graph of an ordered pair is a point. An ordered pair can also be a solution to a linear equation in two variables. Since there are an infinite number of solutions, there are an infinite number of ordered pairs and an infinite number of points. If we can plot these points, we will be graphing the equation. What will this graph look like? Let’s look at the equation y = -3x + 4. To look for a solution to the equation, we can choose any value for x. For convenience we will choose x = 0. That is, the first coordinate of the ordered pair will be 0. To complete the ordered pair (0, ), we substitute 0 for x in the equation:
y==-3x+4==-3(0) + 4==0+4==4
Thus the ordered pair is (0, 4).
To find another ordered pair that is a solution to the equation y = -3x + 4, let x= 1.
y==-3x+4==-3(1) +4==-3+4==1
Thus the ordered pair (1, 1) is another solution to the equation.
The graph of these two ordered pairs or solutions is shown below. From geometry we know that two points determine a line. Thus we can say that the line that contains the two points is the graph of the equation y = -3x + 4. In fact, the graph of any linear equation in two variables is a straight line.

While you only need two points to determine a line, we recommend that you use three points to graph an equation. Two points to determine the line and a third point to verify. For ease in plotting the points it is better that the ordered pairs contain integers.

EXAMPLE 1 Find three ordered pairs that satisfy 2x+y=4. Then graph the resulting straight line.
Since we can choose any value for x, choose those numbers that are convenient. To organize the results, we will make a table of values. We will let x = 0, x = 1, and x = 3, respectively. We write these numbers under x in our table of values. For each of these x values, we find the corresponding y value in the equation 2x + y = 4

We record these results by placing each y value in the table next to its corresponding x value. Keep in mind that these values represent ordered pairs each of which is a solution to the equation. Since there are an infinite number of ordered pairs, we will prefer those with integers whenever possible.

If we plot these ordered pairs and connect the three points, we get a straight line that is the graph of the equation 2x + y = 4. The graph of the equation is shown in the figure below.

EXAMPLE 2 Graph 5x-4y + 2 =2.
First, we simplify the equation by adding -2 to each side.
5x -4y+2=2
5x-4y+2-2=2-2
5x-4y =0
Since we are free to choose any value of x, x = 0 is a natural choice. Calculate the value of y when x = 0.
5x-4y =0
5(0)-4y =0
-4y =0
y=0 Remember: Any number times 0 is 0. Since -4y=0, y must equal 0.
Now let’s see what happens when x = 1.
5x-4y =0
5(1)-4y = 0
5-4y=0
-4y = -5
y=-5/-4 or 5/4 This is not an easy number to graph.
A better choice for a replacement of x is a number that is divisible by 4. Let’s see why.
Let x = 4 and let x = -4.
5x-4y=0 5x-4y=0
5(4)-4y=0 5(-4)-4y=0
20-4y=0 -20-4y=0
-4y=-20 -4y=20
y=-20/-4 or 5 y=20/-4 or -5

To Think About In Example 2, we picked values of x and found the corresponding values for y. An alternative approach is to first solve the equation for the variable y. Thus
5x-4y = 0
-4y = -5x Add -5x to each side.
(-4y)/-4= (-5x)/-4 Divide each side by -4.
y=5/4x
Now let x =-4, x = 0, and x = 4, and find the corresponding values of y. Graph the equation.
In the previous two examples we began by picking values for x. We could just as easily have chosen values for y.
EXAMPLE 3 Graph 3x-4y = 12.
We first find three ordered pairs by arbitrarily picking three values for y and in each case solving for x. We will choose y=0, y=3, and y=-3. Can you see why?

Graphing a Straight Line by Plotting Its Intercepts
What values should we pick for x and y? Which points should we use for plotting? For many straight lines it is easiest to pick the two intercepts . A few lines have only one intercept. We will discuss these separately.


EXAMPLE 4. Graph 5y-3x = 15 by the intercept method.
Let y = 0.
5(0)-3x = 15 Replace y by 0.
-3x = 15 Simplify.
x=-5 Divide both sides by -3.
The x-intercept is -5.
The ordered pair is (-5, 0), the x-intercept point.
Let x = 0.
5y-3(0) = 15 Replace x by 0.
5y = 15 Simplify.
y=3 Divide both sides by 5.
The y-intercept is 3.
The ordered pair is (0, 3), the y-intercept point.
We find another pair to have a third point.
Let y = 6.
5(6)-3x = 15 Replace y by 6.
30-3x = 15 Simplify.
-3x = -15 Subtract 30 from both sides.
x=-15/-3 or 5
The ordered pair is (5, 6).

Graphing Horizontal and Vertical Lines
You will notice that the x-axis is a horizontal line. It is the line y = 0, since for any x, y is 0. Try a few points. (1, 0), (3, 0), (-2, 0) all lie on the x-axis. Any horizontal line will be parallel to the x-axis. Lines such as y = 5 and y = 2 are horizontal lines. What does y = 5 mean? It means that, for any x, y is 5. Likewise y = -2 means that, for any x, y= -2.

How can we recognize the equation of a line that is horizontal, that is, parallel to the x-axis.

EXAMPLE 5 Graph y = -3.
You could write the equation as 0x + y = -3. Then it is clear that for any value of x that you substitute you will always obtain y=-3. Thus, as shown in the figure, (4, -3), (0, -3), and (-3, -3) are all ordered pairs that satisfy the equation y = -3. Since the y-coordinate of every point on this line is -3, it is easy to see that the horizontal line will be 3 units below the x-axis.

Notice that the y-axis is a vertical line. This is the line x = 0, since, for any y, x is 0. Try a few points. (0, 2), (0, -3), (0, 4) all lie on the y-axis. Any vertical line will be parallel to the y-axis. Lines such as x = 2 and x =-3 are vertical lines. Think of what x = 2 means. It means that, for any value of y, x is 2. x = 2 is a vertical line two units to the right of the y-axis.

How can we recognize the equation of a line that is vertical, that is, parallel to the y-axis?

EXAMPLE 6 Graph x=5
This can be done immediately by drawing a vertical line 5 units to the right of the origin. The x-coordinate of every point on this line is 5.
The equation x-5 = 0 can be rewritten as x=5 and graphed as shown.

Slope of a Line
After studying this section, you will be able to:
1. Find the slope of a straight line given two points on the line.
2. Find the slope and y-intercept of a straight line, given the equation of the line.
3. Write the equation of a line, given the slope and the y-intercept.
4. Graph a line using the slope and y-intercept.
5. Find the slopes of lines that are parallel or perpendicular.
Find the Slope of a Straight Line, Given Two Points on the Line
We often use the word slope to describe the incline (the steepness) of a hill. A carpenter or a builder will refer to the pitch or slope of a roof. The slope is the change in the vertical distance compared to the change in the horizontal distance as you go from one point to another point along the roof. If the change in the vertical distance is greater than the change in the horizontal distance, the slope will be steep. If the change in the horizontal distance is greater than the change in the vertical distance, the slope will be gentle.

In a coordinate plane, the slope of a straight line is defined by the change in y divided by the change in x.

Consider the line drawn through points A and B in the figure. If we measure the change from point A to point B in the x-direction and the y-direction, we will have an idea of the steepness (or the slope) of the line. From point A to point B the change in y values is from 2 to 4, a change of 2. From point A to point B the change in x values is from 1 to 5, a change of 4.

Thus,
![]()
Informally, we can describe this move as the rise over the run: slope=rise/run.
We now state a more formal (and more frequently used) definition.

The use of subscripted terms such as x_1, x_2 and so on, is just a way of indicating that the first x value is x_1, and the second x value is x_2. Thus (x_1, y_1) are the coordinates of the first point and (x_2, y_2) are the coordinates of the second point. The letter m is commonly used for the slope.
EXAMPLE 1 Find the slope of the line that passes through (2, 0) and (4, 2).
Let (2, 0) be the first point (x_1, y_1) and (4, 2) be the second point (x_2, y_2)

By the formula,
slope = m= (y_2-y_1)/(x_2-x_1)=(2-0)/(4-2)=2/2=1
The sketch of the line is shown in the figure above.
Note that the slope of the line will be the same if we let (4, 2) be the first point (x_1, y_1) and (2, 0) be the second point (x_2, y_2).

m=(y_2-y_1)/(x_2-x_1)=(0-2)/(2-4)=-2/-2=1
Thus, given two points, it does not matter which you call (x_1, y_1) and which you call (x_2, y_2).
WARNING Be careful, however, not to put the x’s in one order and the y’s in another order when finding the slope, given two points on a line.
EXAMPLE 2 Find the slope of the line through (-3, 2) and (2, -4).
Let (-3, 2) be (x_1, y_1) and (2, -4) be (x_2, y_2)
m=(y_2-y_1)/(x_2-x_1)=(-4-2)/(2-(-3))=(-4-2)/(2+3)=-6/5
The slope of this line is negative. We would expect this since the y value decreased from 2 to -4.
EXAMPLE 3 Find the slope of the line that passes through the given points.
(a) 0, 2) and (5, 2) (b) (-4, 0) and (-4, -4)
(a) Take a moment to look at the y values. What do you notice? What does this tell you about the line? Now calculate the slope.
m=(2-2)/(5-0)=0/5=0

A horizontal line has a slope of 0.
(b) Take a moment to look at the x values. What do you notice? What does this tell you about the line? Now calculate the slope.
m=(-4-0)/(-4-(-4))=-4/0
Recall that division by 0 is undefined.

The slope of a vertical line is undefined. We say that this line has no slope.
Notice in our definition of slope that x_2 != x_1. Thus it is not appropriate to use the formula for slope for the points in (b). We do so to illustrate what would happen if x_2 = x_1. We get an impossible situation, (y_2-y_1)/0. Now you can see why we include the restriction x_2 != x_1, in our definition.

Finding the Slope and y-intercept of a Line, Given the Equation of a Line
Recall that the equation of a line is a linear equation in two variables. This equation can be written in several different ways. A very useful form of the equation of a straight line is the slope—intercept form. The form can be derived in the following way. Suppose that a straight line, with slope m, crosses the y-axis at a point (0, b). Consider any other point on the line and label the point (x, y).

This form of a linear equation immediately reveals the slope of the line, m, and where the line intercepts (crosses) the y-axis, b.

EXAMPLE 4 What is the slope and the y-intercept of the line whose equation is y= 4x - 5?
The equation is in the form y = mx + b.
y = 4x + (-5)
slope = 4 y-intercept = -5
The slope is 4 and the y-intercept is -5.
By using algebraic operations, we can write any linear equation in slope—intercept form and use this form to identify the slope and the y-intercept of the line.
EXAMPLE 5 What is the slope and the y-intercept of the line 5x + 3y = 2?
We want to solve for y and get the equation in the form y = mx + b. We need to isolate the y variable.

Writing the Equation of a Line, Given the Slope and the y-intercept
If we know the slope of a line m, and the y-intercept, b, we can write the equation of the line, y = mx + b.
EXAMPLE 6 Find the equation of the line with slope 2/5 and y-intercept -3.
(a) Write the equation in slope—intercept form, y = mx + b.
(b) Write the equation in Ax + By = C form.
(a) We are given that m = 2/5 and b = -3. Since
y=mx+b
y = 2/5x+(-3)
y=2/5x-3
(b) Recall, for the form Ax + By = C, that A, B, and C are integers. We first clear the equation of fractions. Then we move the x term to the left side.
5y = 5((2x)/5)-5(3) Multiply each term by 5.
5y = 2x -15 Simplify.
-2x+5y=-15 Subtract 2x from each side.
2x-y = 15 Multiply each term by -1. The form Ax + By = C is usually written with A as a positive integer.
Graphing a Line Using the Slope and the y-Intercept
If we know the slope of a line and the y-intercept, we can draw the graph of the line.
EXAMPLE 7 Graph a line with slope m = 2/3 and y-intercept of -3. Use the coordinate system below.
Recall that the y-intercept is the point where the line crosses the y-axis. The x-coordinate of this point is 0. Thus the coordinates of the y-intercept for this line are (0, -3). We plot the point.
Recall that slope =rise/run. Since the slope for this line is 2/3, we will go up (rise) 2 units and go over (run) to the right 3 units from the point (0, -3). Look at the figure below. This is the point (3, -1). Plot the point. Draw a line that connects the two points (0, -3) and (3, -1).

This is the graph of the line with slope 2/3 and y-intercept of -3.
Finding the Slopes of Lines That Are Parallel or Perpendicular
Parallel lines are two straight lines that never touch. Look at the parallel lines in the figure below.

Notice that the slope of line a is -3 and the slope of line b is also -3. Why do you think the slopes must be equal? What would happen if the slope of line b was -1. Try it.

Perpendicular lines are two lines that meet at a 90° angle. Look at the perpendicular lines in the figure below.

The slope of line c is -3. The slope of line d is 1/3. Notice that
(-3)(1/3)=(-3/1)(1/3)=-1
You may wish to draw several pairs of perpendicular lines to determine if this will always happen.

EXAMPLE 8 Linee has a slope of −2/3.
(a) If line f is parallel to line e, what is its slope?
(b) If line g is perpendicular to line e, what is its slope?
(a) Parallel lines have the same slope.
Line f will have a slope of −2/3.
(b) Perpendicular lines have slopes whose product is -1.
m_1m_2 = -1
−2/3m_2=-1 Substitute −2/3 for m_1.
(-3/2)(-2/3)m_2=-1(-3/2) Multiply both sides by −3/2.
m_2=3/2
The slope of the line g is 3/2
Obtaining the Equation of a Line
After studying this section, you will be able to:
1. Write the equation of a line, given a point and a slope.
2. Write the equation of a line, given two points.
3. Write the equation of a line, given a graph of the line.
Writing the Equation of a Line, Given a Point and a Slope
If we know the slope of a line and the y-intercept, we can write the equation of the line in slope—intercept form. Sometimes we are given the slope and a point on the line. We use the information to find the y-intercept. Then we can write the equation of the line.
EXAMPLE 1 Find the equation of a line with a slope of 4 that passes through the point (3, 1).
We are given the following values: m = 4, x = 3, y = 1.
y=mx+b
We are given that the slope of the line is 4.
y=4x+b
Since (3, 1) is a point on the line, it satisfies the equation. Substitute x = 3 and y = 1 into the equation.
1=4(3)+b
Solve for b.
1=12+b
-11=b
Thus the y-intercept is -11. We can now write the equation of the line.
y=4x- 11
It may be helpful to summarize our approach.

EXAMPLE 2 Find the equation of a line with slope −2/3 that passes through the point (-3, 6).
We write out the values m = −2/3, x = -3, y = 6.
y=mx+b
6= (-2/3)(-3)+b Substitute known values.
6=2+b
4=b
The equation of the line is y = −2/3x+ 4.
Finding the Equation of a Line, Given Two Points
Our procedure can be extended to the case for which two points are given.
EXAMPLE 3 Find the equation of a line that passes through (2, 5) and (6, 3).
We first find the slope of the line. Then we proceed as in Example 2.
m=(y_2-y_1)/(x_2-x_1)
m=(3-5)/(6-2) Substitute (x_1, y_1) = (2,5) and (x_2, y_2) = (6, 3) into the formula.
m=-2/4 = −1/2
Choose either point, say (2,5), and proceed as in Example 2.
y=mx+b
5 = −1/2(x)+b
5=-1+b
6=b
The equation of the line is y = −1/2x + 6.
Note: After finding the slope m = −1/2, we could have used the other point (6, 3) and would have arrived at the same answer. Try it.
Finding the Equation of a Line from the Graph
EXAMPLE 4 What is the equation of the line in the figure below?

First, look for the y-intercept. The line crosses the y-axis at (0,4). Thus b=4.
Second, find the slope.

Look for another point on the line. We chose (5, -2). Count the number of vertical units from 4 to -2 (rise). Count the number of horizontal units from 0 to 5 (run).
m=-6/5
Now we can write the equation of the line, m = −6/5 and b = 4.
y=mx+b
y = −6/5x+4
Graphing Linear Inequalities
After studying this section, you will be able to:
1. Graph linear inequalities in two variables.
In earlier tutorial we discussed inequalities in one variable. Look at the inequality x < -2 (x is less than -2). Some of the solutions to the inequality are -3, -5, and -51/2. In fact all numbers to the left of -2 on the number line are solutions. The graph of the inequality is given below. Notice that the open circle at 2 indicates that 2 is not a solution.

Graphing Linear Inequalities in Two Variables
Consider the inequality y >= x. The solution of the inequality is the set of all possible ordered pairs that when substituted into the inequality will yield a true statement. Which ordered pairs will make the statement y>=x true? Let’s try some.
(0, 6) (-2, 1) (1, -2) (3, 5) (4, 4)
6 >= 0, true 1>= -2, true -2 >= 1, false 5 >= 3, true 4>= 4, true
(0, 6), (-2, 1), (3, 5), and (4, 4) are solutions to the inequality y >= x. In fact, every point at which the y-coordinate is greater than or equal to the x-coordinate is a solution to the inequality. This is shown by the shaded region in the graph below. Notice that the solution set includes the points on the line y = x.

Did we need to test so many points? The solution set for an inequality in two variables will be the region above the line or the region below the line. It is sufficient to test one point. If the point is a solution to the inequality, shade the region that includes the point. If the point is not a solution, shade the region on the other side of the line.
EXAMPLE 1. Graph 5x + 3y > 15. Use the coordinate system below.
We begin by graphing the line 5x + 3y = 15. You may use any method discussed previously to graph the line. Since there is no equal sign in the inequality, we will draw a dashed line to indicate that the line is not part of the solution set.
Look for a test point. The easiest point to test is (0, 0). Substitute (0, 0) for (x, y) in the inequality.
5x+3y>15
5(0)+3(0)>15
0>15 False.

(0,0) is not a solution. Shade the side of the line that does not include (0, 0)

EXAMPLE 2 Graph 2y <= -3x.
Step 1 Graph 2y = -3x. Since ≤ is used, the line should be a solid line.
Step 2 We see that the line passes through (0, 0).
Step 3 Choose another test point. We will choose -3,-3
2y <= -3x
2(-3)<=-3(-3)
-6<=9 True.

Shade the region that includes (-3, -3). Shade the region below the line.
If we are graphing the inequality x<-2 on the coordinate plane, the solution will be a region. Notice that this is very different from the solution x<-2 on the number line discussed earlier.
EXAMPLE 3 Graph x < -2 on the coordinate plane.
Step 1 Graph x = -2. Since < is used, the line should be dashed.
Step 2 Test (0,0) in the inequality.
x<-2
0<-2 False.

Shade the region that does not include (0, 0). Shade the region to the left of the line x=-2
Functions
After studying this section, you will be able to:
1. Understand and use the definition of a relation and a function.
2. Graph simple nonlinear equations.
3. Determine if a graph represents a function.
4. Use function notation.
Understanding and Using the Definitions of Relation and Function
Thus far you have studied linear equations in two variables. You have seen that such an equation can be represented by a table of values, by the algebraic equation itself, and by a graph.
The solutions to the linear equation are all the ordered pairs that satisfy the equation (make the equation true). They are all the points that lie on the graph of the line. These ordered pairs can be represented in a table of values. Notice the relationship between the ordered pairs. We can choose any value for x. But once we have chosen a value for x, the value of y is determined. For example, in the equation y=-3x+4 if x is 0, then y must be 4. We say that x is the independent variable and that y is the dependent variable .
Mathematicians call such a pairing of two values a relation.

All the first coordinates in each ordered pair make up the domain of the relation. All the second coordinates in each ordered pair make up the range of the relation. Notice that the definition of a relation is very broad. Some relations cannot be described by an algebraic expression. These relations may simply be a set of discrete ordered pairs.
EXAMPLE 1 State the domain and range of the following relation.
{(5, 7), (9, 11), (10, 7), (12, 14)}
The domain consists of all the first coordinates in the ordered pairs.

The range consists of all of the second coordinates in the ordered pairs. Thus
The domain is {5, 9, 10, 12}
The range is {7, 11, 14} We only list 7 once.
Some relations have a special property and are called functions. The relation y = -3x + 4 is a function. If you look at its table of values, no two different ordered pairs have the same first coordinate. If you look at its graph, you will notice that any vertical line intersects the graph only once. Sometimes we get a better idea if we look at some relations that are not functions. Look at y^2 = x.

Notice that, if x is 1, y could be 1 since 1^2 = 1 or y could be -1 since (-1)^2 = 1. That is, the ordered pairs (1, -1) and (1, 1) both have the same first coordinate. y^2 = x is not a function. What do you notice about the graph?

EXAMPLE 2 Determine if the relation is a function or not a function.
(a) {(3, 9), (4, 16), (5, 9), (6, 36)} (b) {(7, 8), (9, 10), (12, 13), (7, 14)}
(a) Look at the ordered pairs. No two ordered pairs have the same first coordinate. Thus (a) is a function. Note that the ordered pairs (3,9) and (5,9) have the same second coordinate, but this does not keep the relation from being a function.
(b) Look at the ordered pairs. Two different ordered pairs, (7, 8) and (7, 14), have the same first coordinate. Thus this relation is not a function.
Functions are what we hope to find when we analyze two sets of data. Look at the table of values that compares Celsius temperature with Fahrenheit temperature. Is there a relationship between degrees Fahrenheit and degrees Celsius? Is the relation a function?

Since every Fahrenheit temperature produces a unique Celsius temperature, we would expect this to be a function. We can verify our assumption by looking at the formula C = 5/9(F-32) and its graph. The formula is a linear equation, and its graph is a line with a slope 5/9 and y-intercept at about -17.8. The relation is a function. Notice that the dependent variable is C, since the value of C depends on the value of F. We say that F is the independent variable . The domain can be described as the set of possible values of the independent variable. The range is the set of corresponding values of the dependent variable. Scientists believe that the coldest temperature possible is approximately -273°C. They call this temperature absolute zero. Thus,
Domain = {all possible Fahrenheit temperatures from absolute zero to infinity}
Range = {all corresponding Celsius temperatures from -273°C to infinity}
EXAMPLE 3 Determine if the relation is a function or not a function. If it is a function, identify the domain and range.

(a) Looking at the table, we see that no two different ordered pairs have the same first coordinate. The area of a circle is a function of the length of the radius.
Next we need to identify the independent variable in order to determine the domain. Sometimes it is easier to identify the dependent variable. Here we notice that the area of the circle depends on the length of the radius. Thus radius is the independent variable. Since a negative length does not make sense, the radius cannot be a negative number.
Domain = {all nonnegative real numbers}
Range = {all nonnegative real numbers}
(b) No two different ordered pairs have the same first coordinate. Interest is a function of time.
Since the amount of interest paid on a loan depends on the number of years (term of the loan), interest is the dependent variable and time is the independent variable. Negative numbers do not apply in this situation.
Domain = {all positive real numbers greater than 1}
Range = {all positive real numbers greater than $320}
Graphing Simple Nonlinear Equations
Thus far in this lesson we have graphed linear equations in two variables. We now turn to graphing a few nonlinear equations. We will need to plot more than three points to get a good idea of what the graph will look like.
EXAMPLE 4 Graph y = x^2.
Begin by constructing a table of values. We select values for x and then determine by the equation the corresponding values of y. We will include negative values for x as well as positive values. We then plot the ordered pairs and connect the points with a smooth curve.
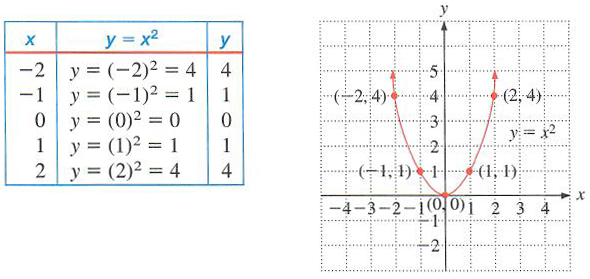
This type of curve is called a parabola. We will study the graph of these types of curves more extensively in later tutorials.
EXAMPLE 5 Graph x = y^2 + 2.
We will select a value of y and then substitute it into the equation to obtain x. For convenience in graphing, we will repeat the y column at the end so that it is easy to write the ordered pairs (x, y).

If the equation involves fractions with variables in the denominator, we must use extra caution. You may never divide by zero.
EXAMPLE 6 Graph y=4/x.
It is important to note that x cannot be zero because division by zero is not defined. y = 4/0 is not allowed! Observe that when we draw the graph we get two separate branches of the curve that do not touch.

Determining If a Graph Represents a Function
Can we tell from a graph if it is the graph of a function? Recall that a function must have the property that no two different ordered pairs have the same first coordinate. That is, each value of x must have a separate unique value of y. Look at the graph of y = x^2 in Example 4. Each x value has a unique y value. Look at the graph of x = y^2 + 2 in Example 5. At x = 3 there are two y values, 1 and -1. In fact, for every x value greater than 2 there are two y values. x = y^2 + 2 is not a function.

Observe that we can draw a vertical line through (6, 2) and (6, -2). Any graph that is not a function will have at least one region in which a vertical line will cross the curve more than once.

EXAMPLE 7 Determine if each of the following is the graph of a function.

(a) The graph of the straight line is a function. A vertical line can only cross this straight line in one location.
(b) and (c) Each of these graphs is not the graph of a function. In each case a vertical line can cross the curve in more than one place.

Using Function Notation
We have seen that an equation like y = 2x + 7 is a function. For each value of x, the equation assigns a unique value to y. We could say ‘‘y is a function of x.’’ This statement can be symbolized by using the function notation y = f(x). Thus you can avoid the y variable completely and describe an expression like 2x + 7 as a function of x by writing f(x) = 2x + 7.
WARNING Be careful. The notation f(x) does not mean f multiplied by x.
EXAMPLE 8 If f(x) = 2x + 7, then find f(3).
f(3) means that we want to find the value of the function f(x) when x = 3. In this example f(x) is 2x + 7. Thus we substitute 3 for x wherever x occurs in the equation and evaluate.
f(x) = 2x +7
f(3) = 2(3)+7=6+7= 13
EXAMPLE 9 If f(x) = 3x^2-4x + 5, find:
(a) f(2) (b) f(-2) (c) f(4)
(a) f(2) = 3(2)^2-4(2) +5 = 3(4)-4(2)+5 = 12-8 +5 =9
(b) f(-2) = 3(-2)^2-4(-2) + 5 = 3(4)-4(-2) +5 = 12 +8 +5 =25
(c) f(4) = 3(4)^2-4(4) + 5 = 3(16)-4(4) + 5 = 48-16+5 = 37
When evaluating a function it is helpful to place parentheses around the value that is being substituted for x. Taking the time to do this will minimize sign errors in your work.