
Graphing Systems of Equations
Original question text:
Graphing Systems Of Equations?
Can someone explain to me how to do "graph systems of equations" or give me a link to where i can go learn it?also how to tell if it is no solution, infinite solutions, or 1 solution?How can Algebrator help you with this problem?
Algebrator can easily solve problems such as the one you posted on Yahoo Answers.
In order to understand clearly the "Graphing Method", you can see an example using Algebrator.
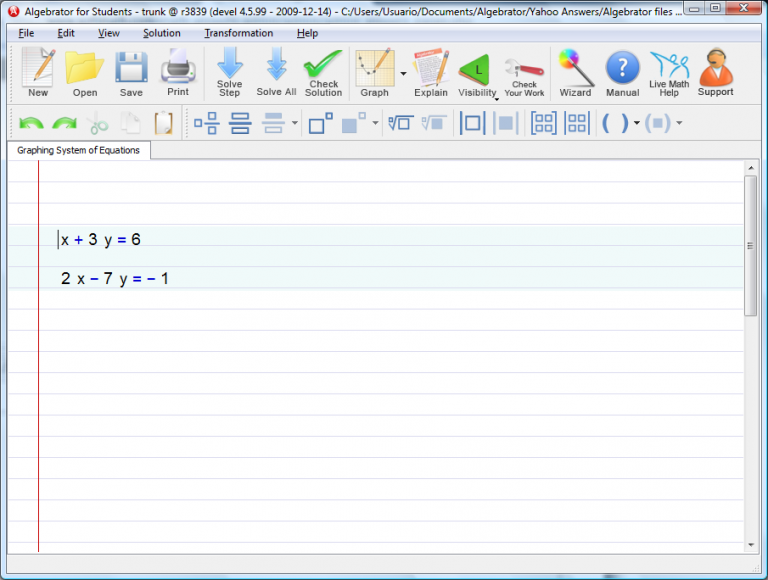
You start by entering the System of Equations in an intuitive math editor and then press "Graph".
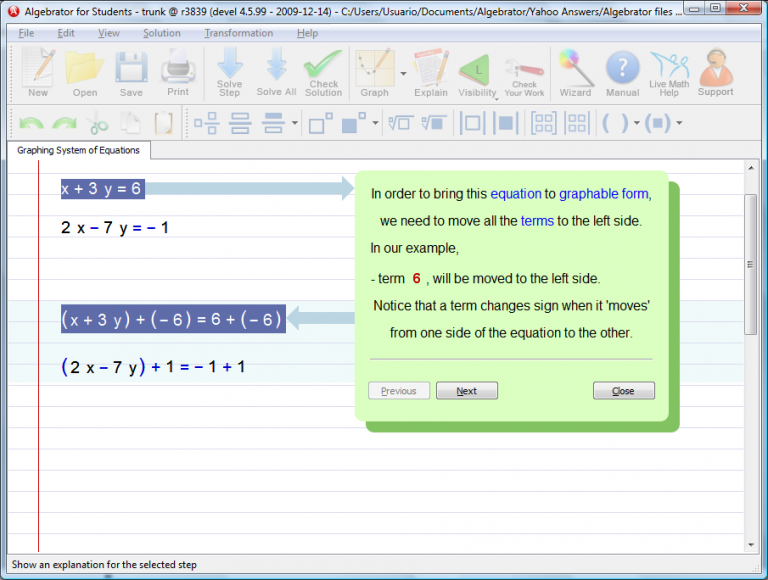
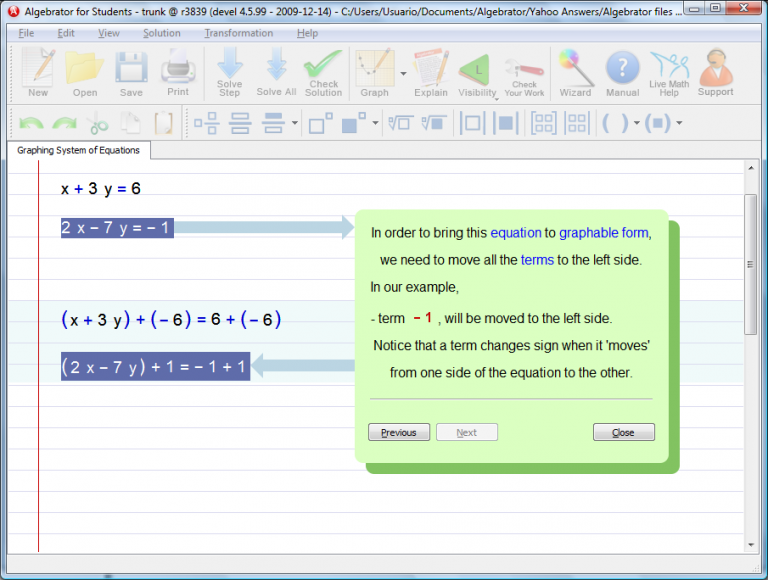
Entering any graphable equation directly into a new worksheet and pressing "Graph All" will first result in that equation being
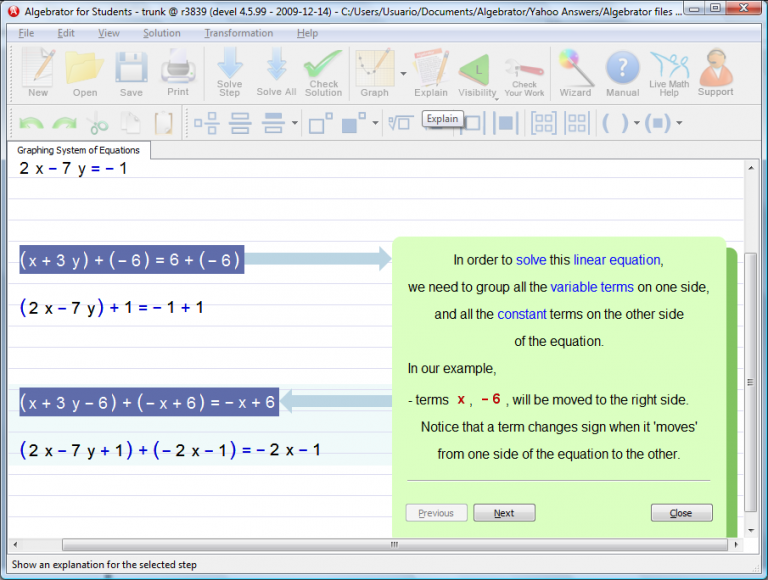
placed into its standard form prior to graphing. For linear equations the standard form is "y=mx+b", where "m" is the slope and "b" the y-intercept.
To solve the equation graphically, simply enter each equation on its own line within the same worksheet and then press "Graph All".
It is important to understand that anytime you are solving a system of equations you are answering the basic question "Do the graphs of these equation touch?". They may touch in one point (one solution), no points (no solutions) or an infinite number of points (i.e. the equations define the same line).
For this reason, it is always helpful to press "Graph All" even it you are not seeking a graphical solution, as this allows you to see a graph of the equations and better understand the numerical solution you obtained.
You can see the rest of the solution process by clicking on the "Graph" button several times.
Some Important features are:
1.Flash demos, found under the drop-down menu "Help->Tutors".
The demos are also available online at "https://softmath.com/demos/", where you may simply select any of the ".htm" files and the demo will play within your browser
2. Wizard button - for example, click the Wizard button and look under the category of "Line" to see the many useful templates for exploring linear equations.
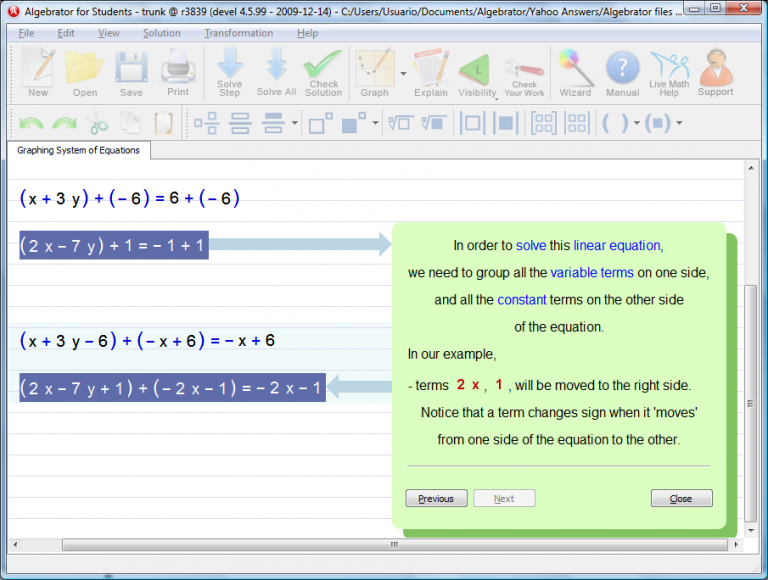
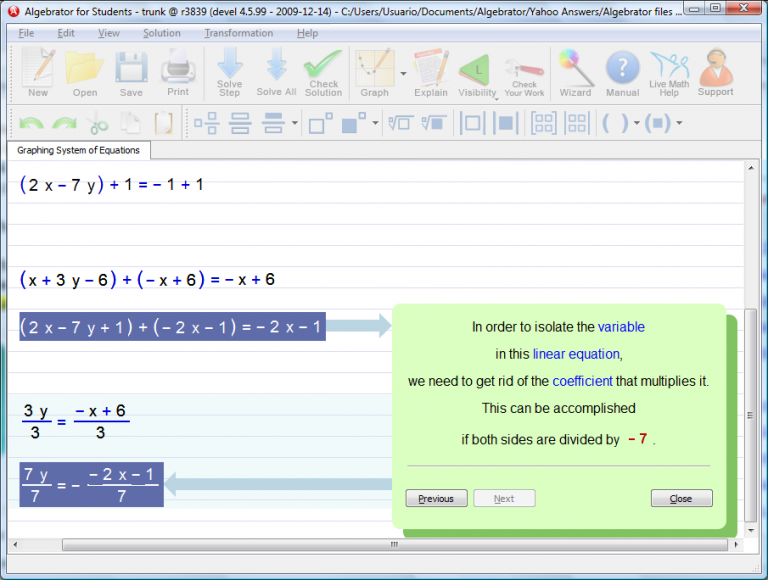
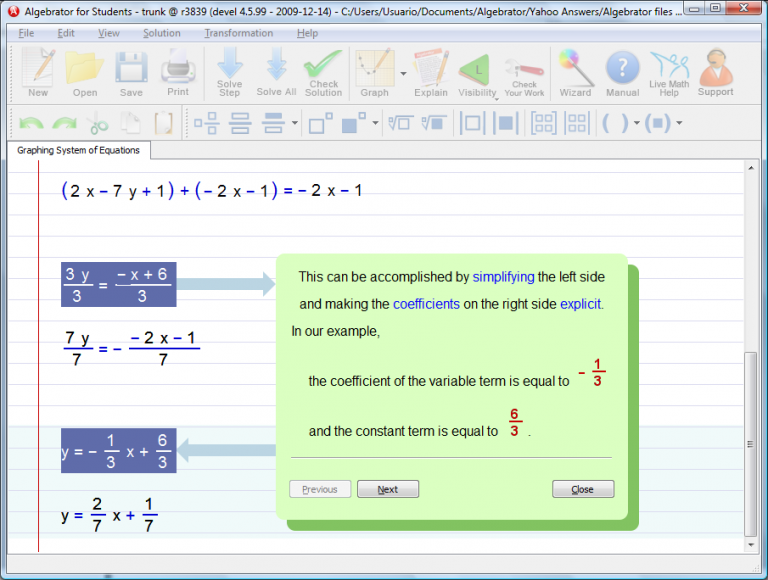
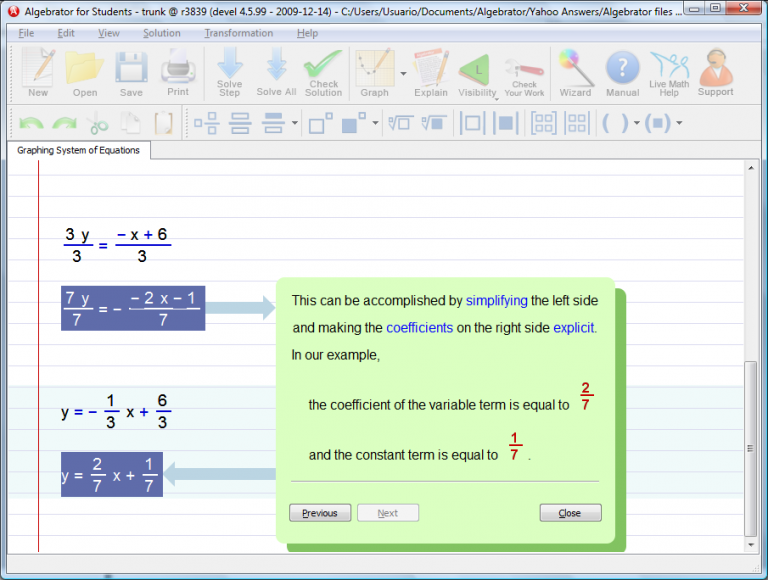
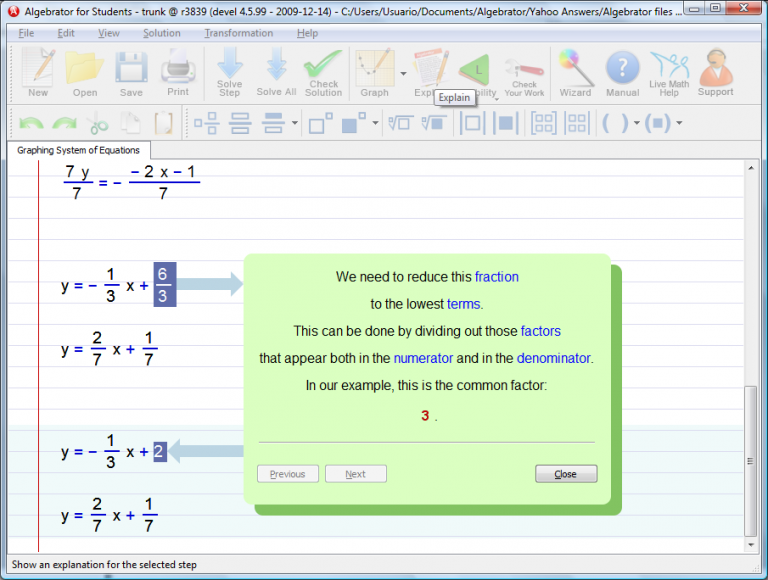
3. The Explain button, which provides the mathematical logic involved in the selected step.
Explanation for this (or any other) step is just a click away.
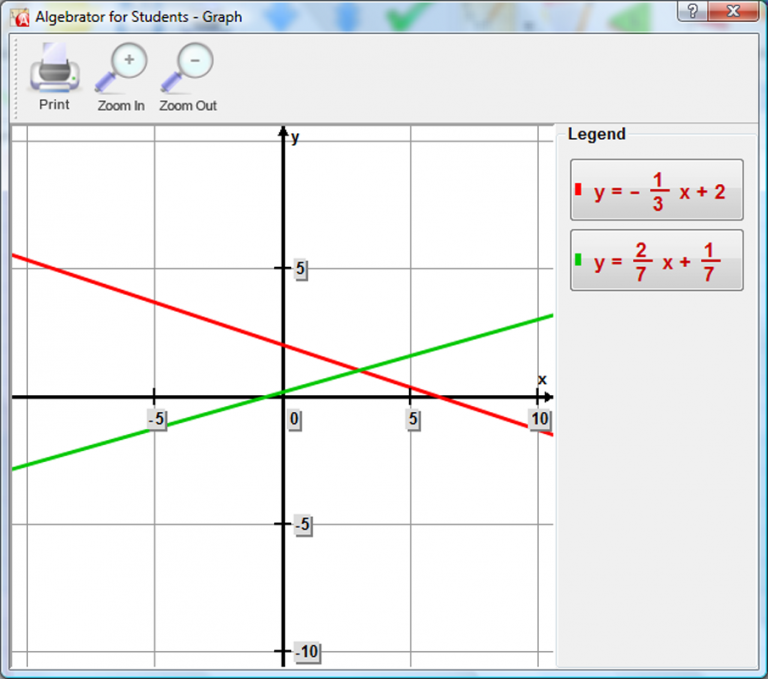
Finally the Graph is shown.
| Prev | See Full List of Math Problems Explained in Detail | Next |
