
Problema Solution
Mr. Jones researched the prices of several different models of cell phones and made a scatter plot of his data. The equation of the line of best fit for Mr. Jones data is = -3.96t + 88.17 , where p is the predict price of a phone and t is the number of moths that the phone has been available. Where is the meaning of the slope of this line?
Answer provided by our tutors
The graph for y = -3.96x + 88.17 is:
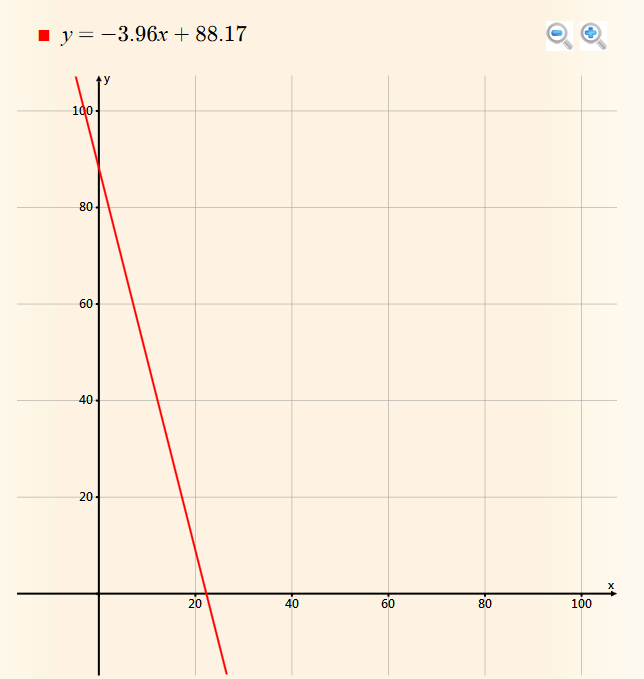
The slope is negative meaning the price is dropping with the number of months passed.
Solving the equation:
-3.96t + 88.17 = 0
........
click here to see the equation solved for t
........
t = 22.27 months
This means that after 22.27 months the price will drop to 0.