Graphing Quadratics Using the TI-83
Teacher’s Notes:
Solutions to Developmental Activity:
1.
| Equation of parabola | Vertex | x- intercept (s) | y-intercept | Axis of symmetry |
| y = x2 | (0, 0) | (0, 0) | (0, 0) | x = 0 |
| y = x2 + 2 | (0, 2) | None | (0, 2) | x = 0 |
| y = x2 – 2 | (0, -2) | 1.41 and –1.41 | (0, -2) | x = 0 |
| y = x2 + x | (-.5, -.25) | 0 and –1 | (0, 0) | x = -.5 |
| y = x2 + 5x | (-2.5, -6.25) | 0 and –5 | (0, 0) | x = -2.5 |
| y = x2 – 5x | (2.5, -6.25) | 5 and 0 | (0, 0) | x = 2.5 |
| y = x2 – 3x +2 | (1.5, -.25) | 2 and 1 | (0, 2) | x = 1.5 |
| y = x2 – 4x | (-2,-4) | 0 and –4 | (0, 0) | x = -2 |
| y = x2 – 3x – 4 | (1.5, -6.25) | 4 and –1 | (0, -4) | x = 1.5 |
2. Answers will vary.
3.
a: Changing a will make the parabola more narrow or wide. Changing the sign
of a
will make the graph open up or down.
b: Changing b will move the vertex of the parabola .
c: Changing c will change the y-intercept.
Ticket Out:
Answers will be collected as the students exit the room. The information will be
used to
assess the students understanding of the lesson covered.
Solutions to Homework:
5. True
7b.
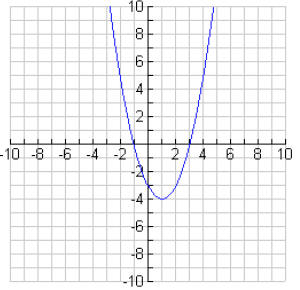
7c. (1, -4); minimum
7d. –3
9a. (-3,1)
9b. x = -3
12a. (-4, 35)
12b. x = -4
12c. 19, 5, -13
Exploring y = ax2 + bx + c
Name: ____________________
Period: _____
Directions: Log on to the computer and go to the following website:
Set the graph tool so that a = 1, b = 0, and c = 0. Click
in the box that says show
vertex/ intercept data .
1. Complete the table below:
| Equation of parabola | Vertex | x-intercept | y-intercept | Axis of symmetry |
| y = x2 | ||||
| y = x2 + 2 | ||||
| y = x2 – 2 | ||||
| y = x2 + x | ||||
| y = x2 + 5x | ||||
| y = x2 – 5x | ||||
| y = x2 – 3x +2 | ||||
| (-2,-4) | 0 and –4 | (0, 0) | ||
| (1.5, -6.25) | 4 and –1 | (0, -4) |
2. Was it difficult to graph the parabola given only the
vertex and the intercepts ?
3. For each letter a, b, and c give a general rule for what happens when you
change only
that value .
a:
b:
c:
Day 3
Lesson Plan:
Objectives:
1. Students will be able to graph and interpret equations of the form y = ax2 +
bx + c.
Standards:
• NCTM Standards covered: Algebra , Representation
• NYS Standards covered: 7A, 7C
Materials:
• Graphing calculators
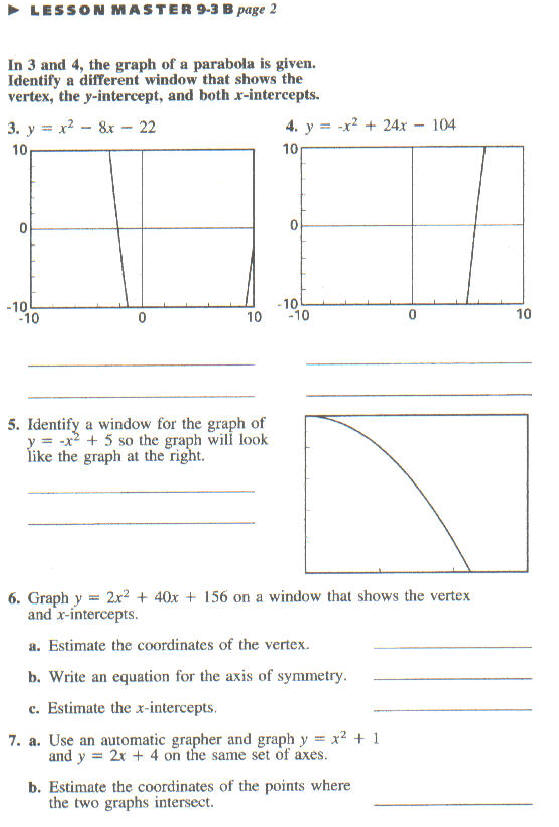
• Lesson Master 9-3B and overhead transparency of worksheet
• Overhead with calculator unit
Opening Activity:
The students will answer the following questions upon entering the room.
Tell what you know about a, b, or c in the equation y = ax2 + bx + c if
1. its vertex is its minimum point
2. the y-axis is the axis of symmetry of the graph
3. The point (0, 6) is on the graph.
Developmental Activity:
The students will work with a partner to complete Lesson Master 9-3B. The
students will
then be selected to present their answers to the class using the overhead
calculator and the
board.
Ticket Out:
Students will have the last 5 minutes of class to respond to the following
question, also to
address any concerns they had with the lesson.
When graphing on a TI-83 how important is it to select the correct window size?
Homework:
Read pgs. 562 – 564, complete pg. 565 # 7 –10.
Teacher’s Notes:
Solutions to Opening Activity:
1. The value of a must be greater than 0.
2. b = 0
3. c = 6
Solutions to Developmental Activity:
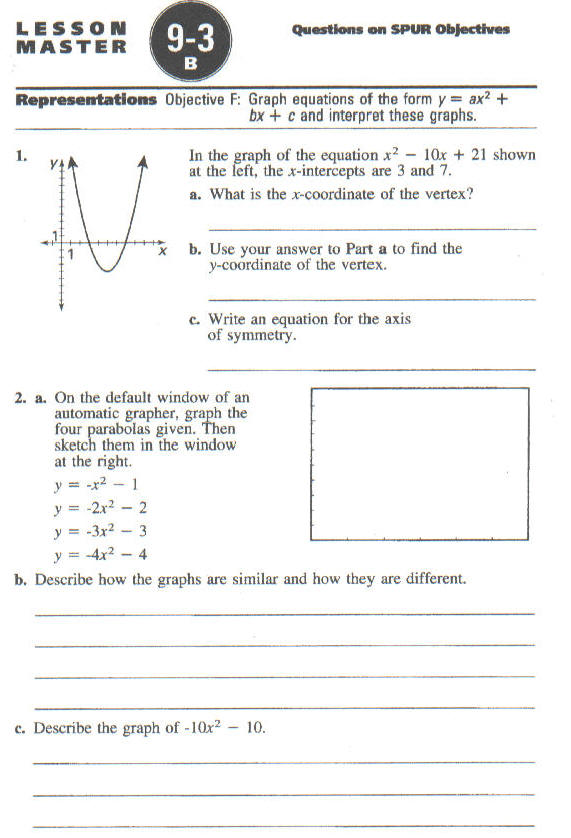
1.
a. 5
b. –4
c. x = 5
2a.
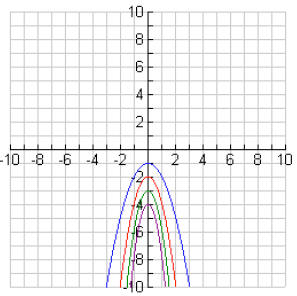
2b. They will all open down and have the y-axis as their
axis of symmetry. Their
vertices are at different points , and their graphs appear to get narrower.
2c. It opens down and has the y-axis as its axis of symmetry. The vertex is at
(0, -10). It
is quite narrow.

6
a. (-10, -144)
b. x = -10
c. –14.7 and –5.3
7b. (-1, 2), (3, 10)
Solutions to Homework:

9a.
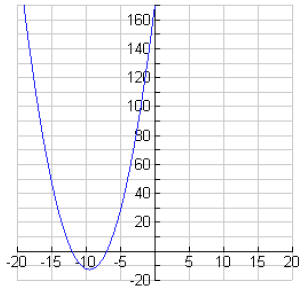
9b. (-9, -12)
9c. x = -9
9d. –12 and –7
10a. 3
10b. 16
| Prev | Next |