Linear_Equations_and_Inequalities
Math 103-1 Final Exam Review Sheet
The final exam is comprehensive. It covers chapters 2, 3,
4, 5, 6, 7, and 8. Specific sections
and content is listed below. You may bring a simple scientific calculator, but
no
graphing/symbolic/cell phone calculators are allowed . You may use a 5×7 inch
hand
written note card. Don't be late.
Chapter 2: Linear Equations and Inequalities
x2.1: Linear Equations : Be able to solve linear
equations. Be able to find the LCD in
case that there are fractions. Be able to check your answer.
x2.2: Linear Equations and Problem Solving: Be able to work with
percentages
and proportions . Two shapes that are the same shape, but a different size are
what?
x2.3: Business and Scientific Problems: Be able to set up and solve a
simply rate
problems. I could ask a business, mixture, or distance problem. What is d = r×t?
Know
the equations for a square, rectangle, circle , and triangle. Be able to solve
given formulas
for another variable . Be able to do a word problem that deals with geometry.
x2.4: Linear Inequalities: Be able to solve linear inequalities of one
variable. When
does the inequality change direction? Be able to state the answer using an
inequality,
interval notation, and on a number line . Be able to solve compound equalities of
the form
5 < 2x - 5 < 10 and of the form 2x > 1 or - 6 > 3x.
x2.5: Absolute Value Equations and Inequalities: Be able to solve basic
absolute
value problems like|2x - 4 |
+ 3 = 6 and like| x + 5|
= |x + 11|.
Make sure and check your
answers because sometimes the ones you find won't work. Be able to solve
absolute value
inequalities like |3x - 4|≥5
and |2 - 1/3x| ≤1/100. Be able to express your
answers on a
number line, with interval notation, and with inequalities.
Chapter 3: Graphs and Functions
x3.1: The Rectangular Coordinate System : Be able to
plot points (ordered pairs).
Be able to build tables from given equations, like lines . Be able to find the
distance between
two given points. What is the Pythagorean Theorem? Be able to find the midpoint
(average)
between two points.
x3.2: Graphs of Equations: Be able to graph a given function by building
a table of
values and plotting those values. Be abe to find intercepts of equations, both x
and y.
x3.3: Slope and Graphs of Linear Equations: Given two points, be able to
find the
slope of the line that passes through them. What kind of lines have zero slope ?
Vertical
(undefined) slope? Given the equation of a line, be able to find its slope. Know
the slope-
intercept form of a line y = mx + b. What is m? What is b? When are two lines
parallel?
Perpendicular? What is m1 = -1=m2 for? Note that slope represents the average
rate of
change of a process .
x3.4: Equations of Lines: Be familiar with the point-slope form of a line
y - y1 =
m(x - x1). What is m? What is (x1; y1)? Be familiar with the general form of a
line
ax + by + c = 0. What is x = a? y = b?
x3.5 Graphs of Linear Inequalities: Be able to sketch the solutions of
linear inequal-
ities.
x3.6 Relations and Functions: What is a relation? What is domain? What is
range?
What is a function? Be familiar with function notation. Be able to evaluation
functions at
a given number, a variable, a smiley face, a tree, or an expression . Be able to
find both the
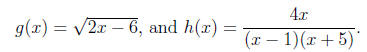
domain and range of a function. Be able to find the domain of functions like f(x)
= x2-4x,
x7. Graphs of Functions: Be able to sketch a function. Be able to use a
table of
values to sketch a graph. Be able to sketch piecewise functions. Be able to
sketch functions
with a given domain. Be able to use the vertical line test to determine whether
a graph is a
function or not (relation). Be familiar with shifts and reflections. Be familiar
with the six
basic functions and their graphs.
| Prev | Next |