Moving Straight Ahead Math Background
Linear relationships are the “big idea” in this unit.
A relationship is linear if there is a constant rate
of change between the two variables . That is, for
each unit change in x, there is a constant change
in y. Throughout the unit, tables, graphs, and
equations are used to explore and represent linear
relationships as well as solve equations . The
mathematics embedded in this unit will be
illustrated through several examples similar to the
problems in the Student Edition.
Developing the Concept
of a Constant Rate or Slope
In the first example, three students determine
their walking rates. Alana walks 1 meter per
second, Gilberto walks 2 meters per second, and
Leanne walks 2.5 meters per second. The distance
d that each person walks in t seconds can be
represented using an equation.

The walking rate is the constant rate of change
between the variables distance and time. The
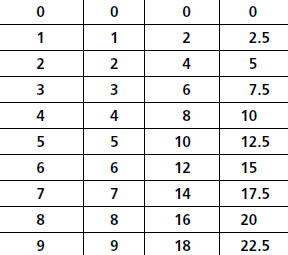
three walking rates are shown in the table.
Walking Rates
| Time (seconds) |
Distance (meters) | ||
| Alana | Gilberto | Leanne | |
 |
|||
In the table, the constant rate of change can be
observed in the following pattern:
As t increases from 0 to 1 second, d increases
by 1 meter for Alana, 2 meters for Gilberto,
and 2.5 meters for Leanne.
As t increases from 1 to 2 seconds, d increases
again by 1 meter for Alana, 2 meters for
Gilberto, and 2.5 meters for Leanne.
This pattern continues; as t increases by one unit,
d increases by a constant amount.
In the symbolic representation, the constant
rate of change shows up as the coefficient of t .

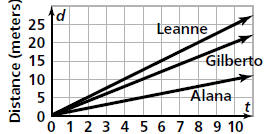
If we graph the data , the constant rate of
change shows up as a straight line.
Walking Rates
Time (seconds)
The walking rate of 2.5 meters per second has a
line that is steeper than the lines representing the
walking rates of 2 meters per second and 1 meter
per second.
Connecting Ratio and Rate Concept
in Linear Functions
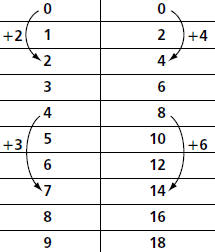
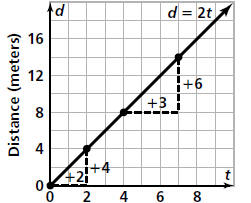
The constant rate of change shown in the table
and graph below is called the slope of the line .
Gilberto’s Walking Rate
| Time (seconds) |
Distance (meters) |
 |
|
Gilberto’s Walking Rate
Time (seconds)
 any two points on
the line. In the example above, the slope is  or
or
 or
or  .
.
To help strengthen students’ understanding of
linear situations, nonlinear situations occur
throughout the unit. Most of these occur as tables
or graphs like the ones below.
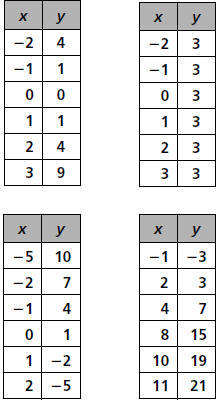
The pattern in the first table is not linear—as x
increases 1 unit, there is not a constant rate of
change in y. This pattern, which can be
represented as y = x2, is studied in Frogs, Fleas,
and Painted Cubes. The pattern in the next three
tables is linear. The constant rate of change in the
first table is 0 and the equation that represents the
pattern is y = 3.The constant rate of change in the
second table is -3 and the y- intercept is 1.Thus,
the equation for this pattern is y = -3x + 1.The
constant rate of change in the last table is 2 and
y-intercept is -1, so the equation is y = 2x - 1.
(Note in the last table, the increments in x are not
equal. Students might first try to plot the points to
see that they all lie on the same line and then use
their understanding of rates and ratios to find the
constant rate is 2.) In equations for linear
relationships, the exponent of the independent
variable x is 1. Since, at this stage, students are not
asked to write equations other than linear
equations, this distinction is left to Frogs, Fleas, and
Painted Cubes and Say It With Symbols.
Finding the Slope of a Line
In Investigation 4, students are introduced to the
idea of slope as a ratio of the vertical change to
the horizontal change between two points on a
line. The ratio concept of slope is connected to the
constant rate of change between two variables.
The slope of a line can be found directly from a
verbal description, a table, an equation, or by
finding the ratio of vertical to horizontal changes
between two points on the line.
For example, suppose you are told the points
(1, 4) and (3, 10) lie on a line and you are asked to
find the slope.
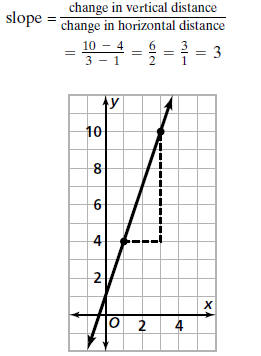
Note the connection to constant rate of change.
As x goes from 1 to 3, the (horizontal) change is 2.
As y goes from 4 to 10, the (vertical) change is 6.
That is, as x changes by 2 units, y changes by
6 units, or as x changes by 1 unit, y changes by
3 units.
The y-Intercept
If you graph C = 150 + 10n, you get a straight
line.
Cost of Bike Rental
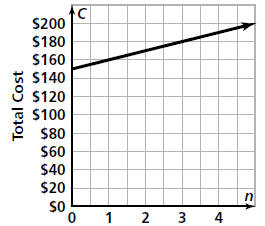
Notice that the line does not pass through the
origin. It crosses the y-axis at $150.This point is
called the y-intercept. The y-intercept is the
constant term in the equation C = 150 + 10n.
Students often refer to the y-intercept as the
“starting point” to generate a table of data for a
linear relationship. For example, in a table of the
data, (0, 150) is the starting point.
There are many ways to find the y-intercept.
• Use a verbal description.
• Use a graph. It is the point (0, b) on the vertical
axis.
• Work backward or forward in a table to find
the point (0, b).
• Substitute the slope and the coordinates of one
point into the equation y = mx + b and then
solve for b. This method is the same as solving
a linear equation in one variable.
| Prev | Next |