Polynomial Functions and Their Graphs
Definition of a Polynomial Function
Let n be a nonnegative integer and let
 be
be
real numbers, with an ≠ 0 .
The function defined by  is called
a polynomial function of x of degree n. The number an , the
coefficient of the variable to the highest power, is called the
leading coefficient.
Note: The variable is only raised to positive integer powers–no
negative or fractional exponents.
However, the coefficients may be any real numbers, including
fractions or irrational numbers like π or
 .
.
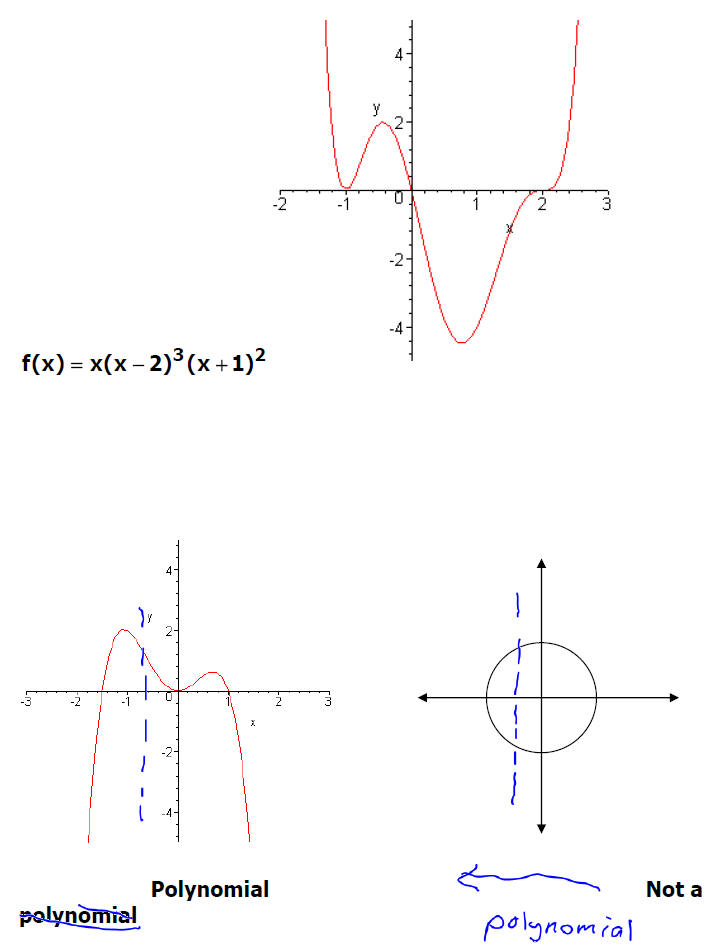
Graph Properties of Polynomial Functions
Let P be any nth degree polynomial function with real coefficients.
The graph of P has the following properties .
1. P is continuous for all real numbers, so there are no breaks,
holes, jumps in the graph.
2. The graph of P is a smooth curve with rounded corners and no
sharp corners.
3. The graph of P has at most n x-intercepts.
4. The graph of P has at most n – 1 turning points.
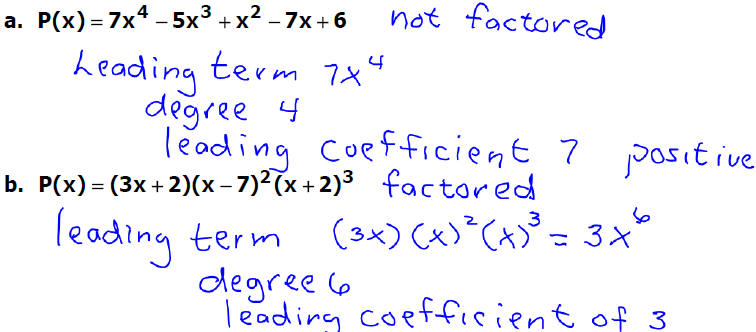
Example 1: Given the following polynomial functions, state the
leading term, the degree of the polynomial and the leading
coefficient.
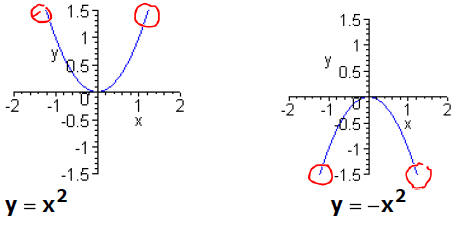
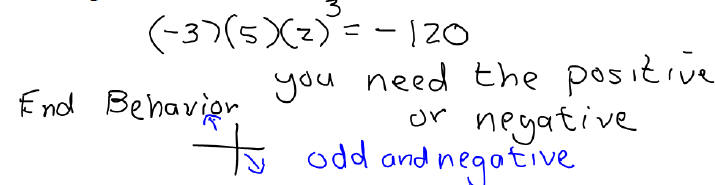
End Behavior of a Polynomial
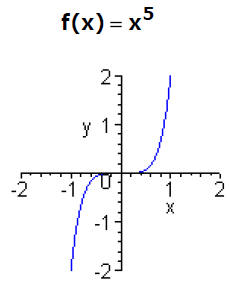
Odd-degree polynomials look like y = ±x3.
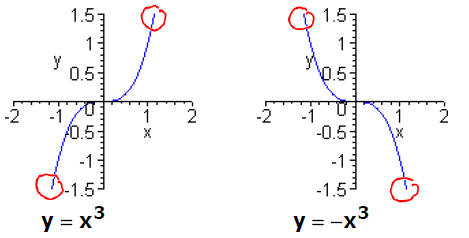
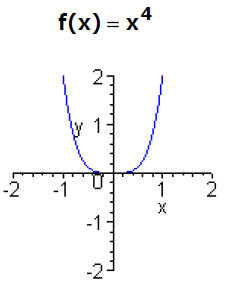
Even-degree polynomials look like y = ±x2 .
Power functions :
A power function is a polynomial that takes the form f(x) = axn ,
where n is a positive integer . Modifications of power functions can
be graphed using transformations.
| Even-degree power functions: | Odd-degree power functions: |
 |
 |
Note: Multiplying any function by a will multiply all the y-values
by a. The general shape will stay the same. Exactly the same as it
was in section 3.4.
Zeros of a Polynomial
Example 1:
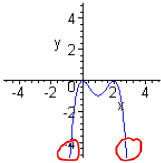
Find the zeros of the polynomial and then sketch the graph.
P(x) = x3 − 5x2 + 6x
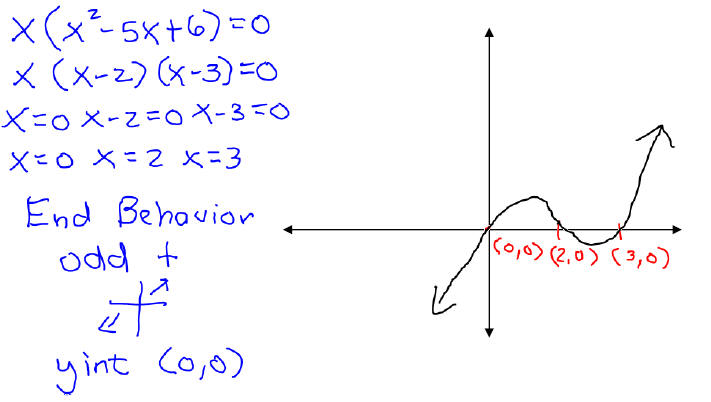
If f is a polynomial and c is a real number for which f (c) = 0 , then c
is called a zero of f, or a root of f.
If c is a zero of f, then
• c is an x- intercept of the graph of f.
• (x − c) is a factor of f .
So if we have a polynomial in factored form, we know all of its xintercepts.
• every factor gives us an x-intercept.
• every x-intercept gives us a factor.
Example 2: Consider the function
f(x) = −3x(x − 3)4(5x − 2)(2x −1)3(4 − x)2.
Zeros (x-intercepts):
To get the degree, add the multiplicities of all the factors:
The leading term is :
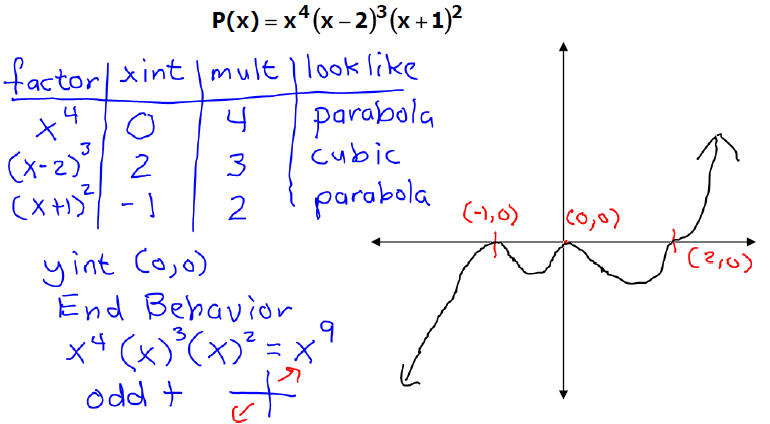
Steps to graphing other polynomials:
1. Factor and find x-intercepts.
2. Mark x-intercepts on x-axis.
3. Determine the leading term.
• Degree: is it odd or even?
• Sign : is the coefficient positive or negative?
4. Determine the end behavior. What does it “look like”?
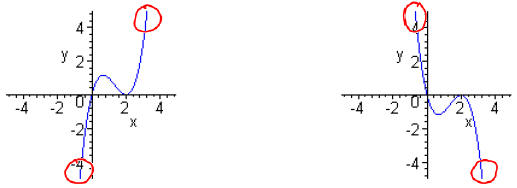
| Odd Degree Sign (+) |
Odd Degree Sign (-) |
 |
 |
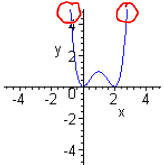
| Even Degree Sign (+) |
Even Degree Sign (-) |
5. For each x-intercept, determine the behavior.
• Even multiplicity: touches x-axis, but doesn’t cross
(looks like a parabola there ).
• Odd multiplicity of 1: crosses the x-axis (looks
like a
line there ).
• Odd multiplicity ≥ 3 : crosses the x-axis and
looks like a
cubic there .
Note: It helps to make a table as shown in the examples
below.
6. Draw the graph, being careful to make a nice smooth
curve with no sharp corners.
Note: without calculus or plotting lots of points, we don’t have
enough information to know how high or how low the turning
points are.
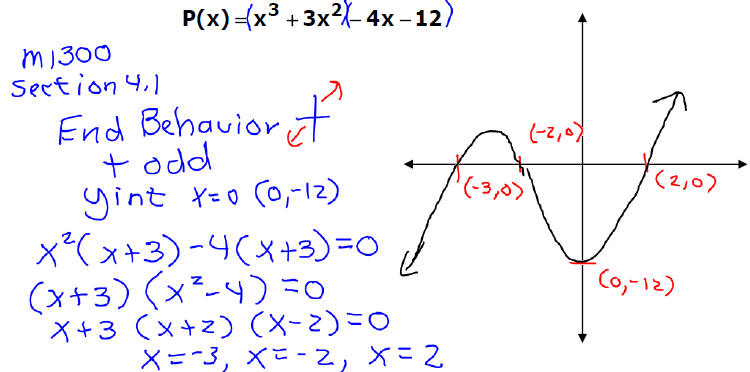
Example 3:
Find the zeros then graph the polynomial. Be sure to label the x
intercepts, y intercept if possible and have correct end behavior.
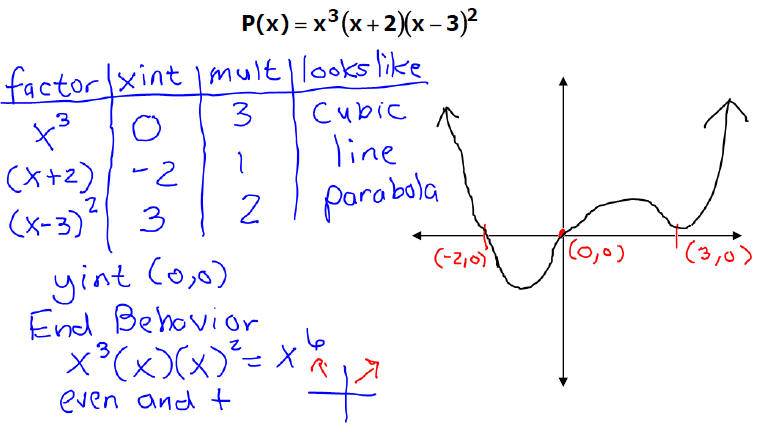
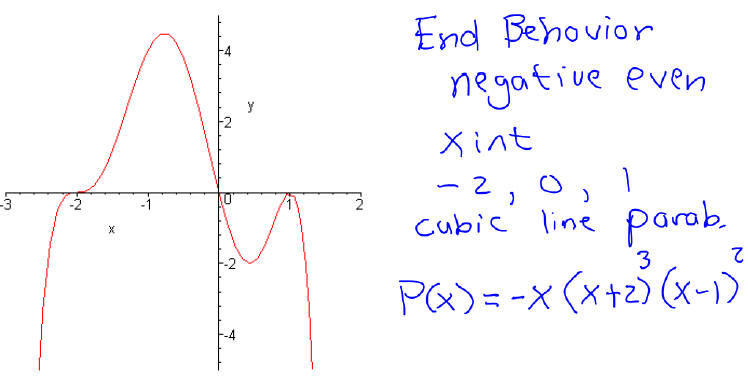
Example 4:
Find the zeros then graph the polynomial. Be sure to label the x
intercepts, y intercept if possible and have correct end behavior.
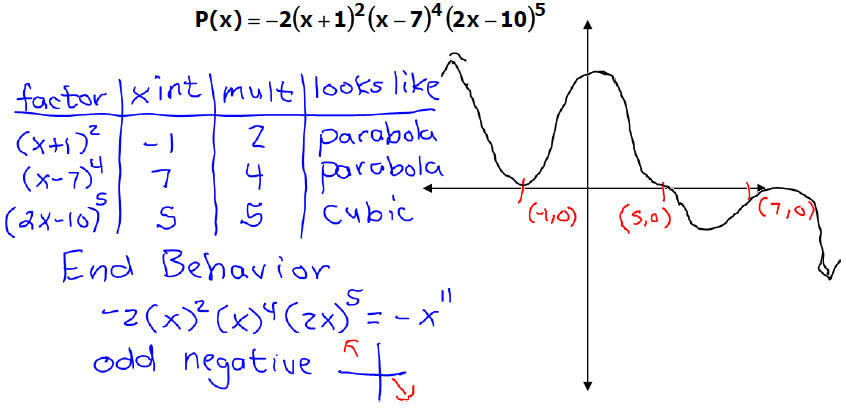
Example 5:
Find the zeros then graph the polynomial. Be sure to label the x
intercepts, y intercept if possible and have correct end behavior.
Example 6:
Find the zeros then graph the polynomial. Be sure to label the x
intercepts, y intercept if possible and have correct end behavior.
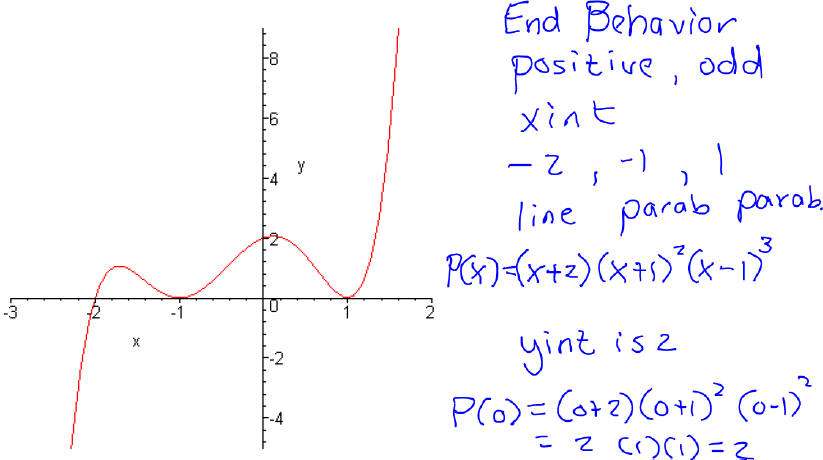
Example 7:
Given the graph of a polynomial determine what the equation of
that polynomial.
Example 8:
Given the graph of a polynomial determine what the equation of
that polynomial.
| Prev | Next |