Algebra and Trigonometry Test
| MULTIPLE CHOICE . Choose the one
alternative that best completes the statement or answers the question. Use the given conditions to write an equation for the line in the indicated form. 1) Passing through (4, 2) and perpendicular to the line whose equation is y = 3x + 7; point- slope form  |
 |
| 2) Passing through (5, 4) and
parallel to the line whose equation is y = 2x - 6; point-slope form
|
 |
| Find the slope then describe what
it means in terms of the rate of change of the dependent variable per
unit change in the independent variable . 3) The linear
function f(x) = -7.9x + 20 models the percentage of people, f(x), who
eat at fast food |
 |
Find the average rate of change of
the function from  to to
 . .4) f(x) = -3x2- x from  = 5 to = 5 to
 = 6 = 6 |
 |
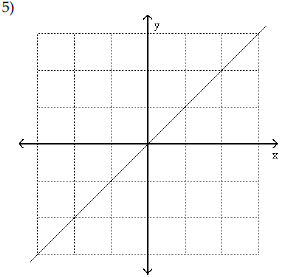
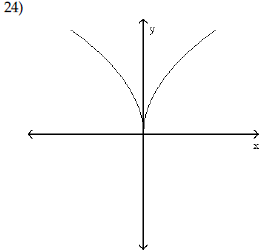
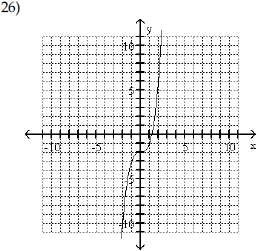
| Use the shape of the graph to name
the function.
A) Absolute value function |
 |
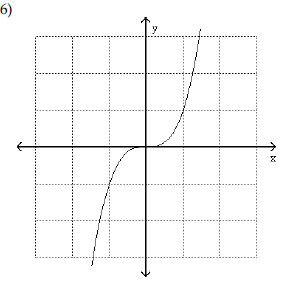 A) Standard quadratic function B) Standard cubic function C) Square root function D) Constant function |
 |
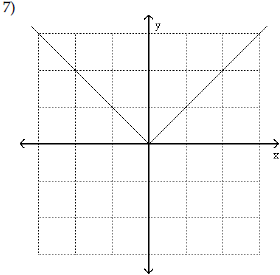
A) Constant function |
 |
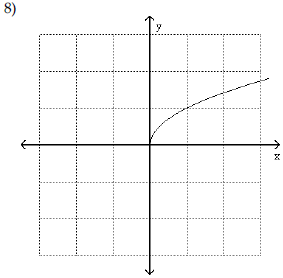
A) Standard cubic function |
 |
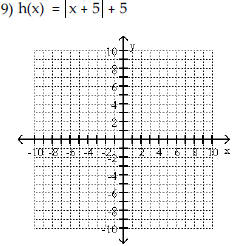
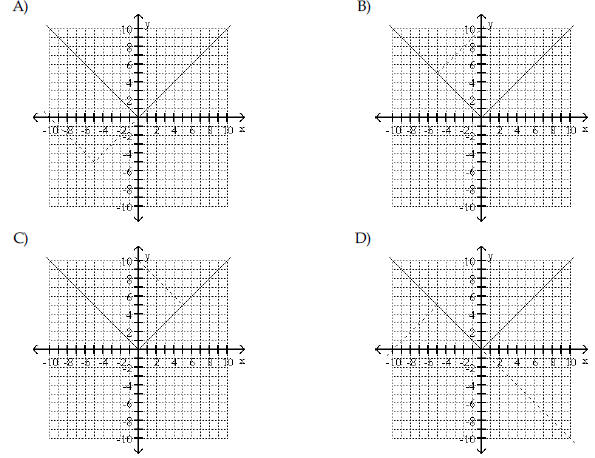
| Begin by graphing the standard
absolute value function f(x) =l xl . Then use transformations of this
graph to graph the given function.
|
 |
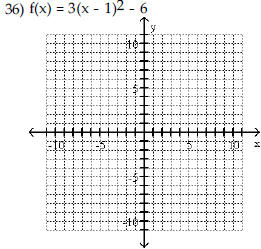
| Begin by graphing the standard
quadratic function f(x) = x2 . Then use transformations of this graph to
graph the given function. 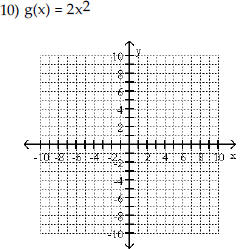 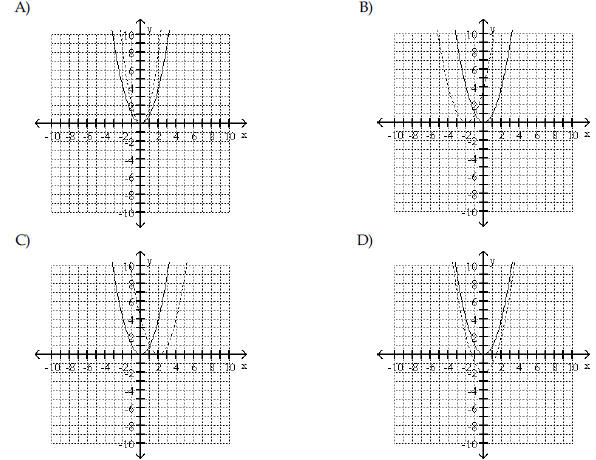 |
 |
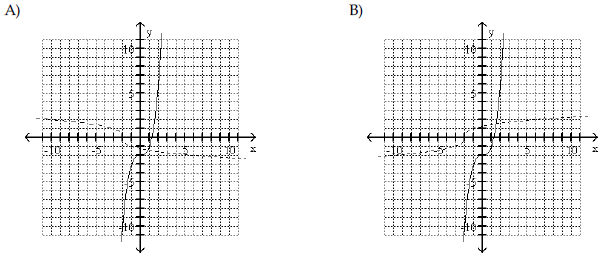
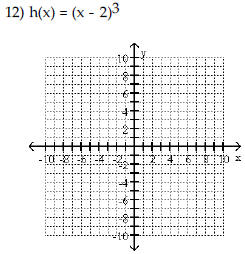
Begin by graphing the standard
function f(x) = x3 Then use transformations of this graph to graph the
given function.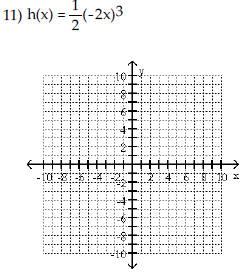 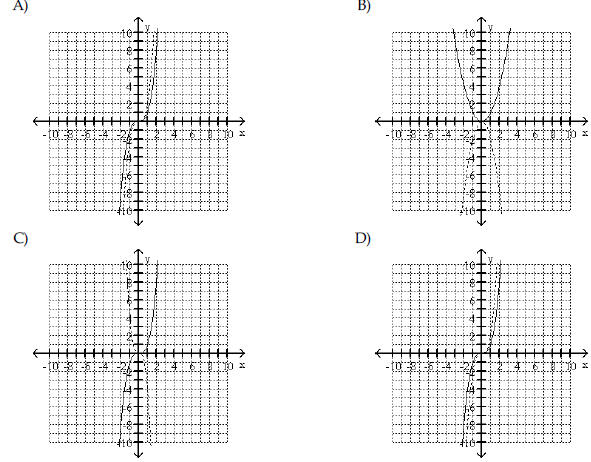 |
 |
 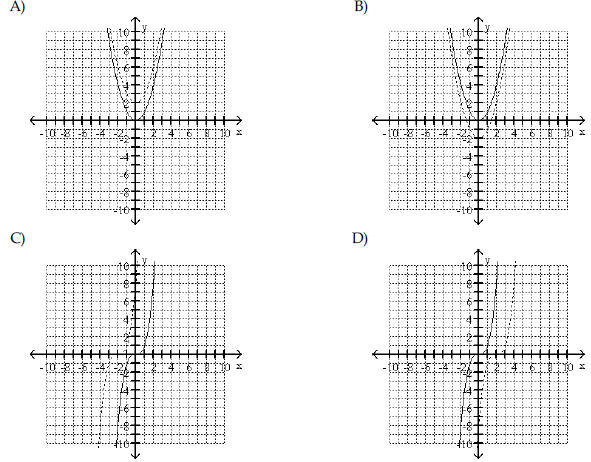 |
 |
| Begin by graphing the standard
quadratic function f(x) = x2 . Then use transformations of this graph to
graph the given function. 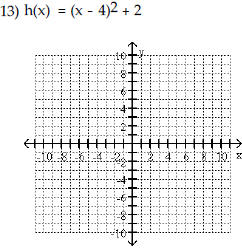 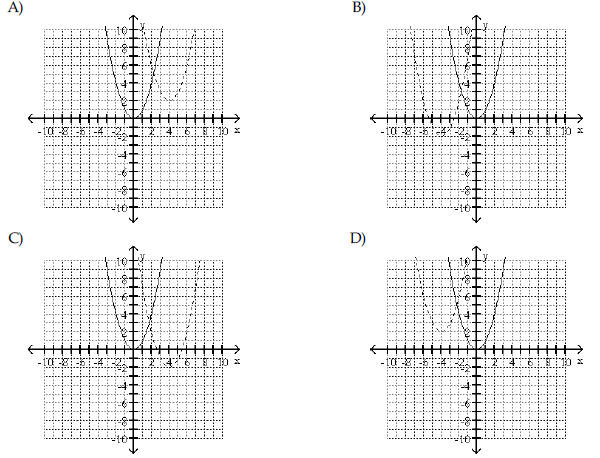 |
 |
Find the domain of the function. |
 |
|
|
 |
| Given functions f and g, determine
the domain of f + g.
|
 |
| For the given functions f and g ,
find the indicated composition.
|
 |
 |
 |
| Find the domain of the composite
function fog.
|
 |
 |
 |
| Determine which two functions are
inverses of each other.
|
 |
| Find the inverse of the one-to-one
function.
|
 |
 |
 |
| Does the graph represent a function
that has an inverse function?
A) Yes |
 |
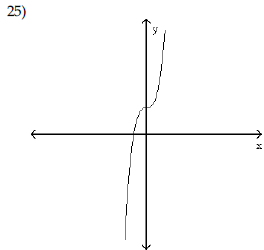
A) Yes |
 |
| Use the graph of f to draw the
graph of its inverse function.
|
 |
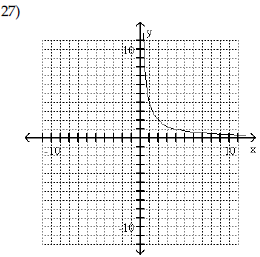 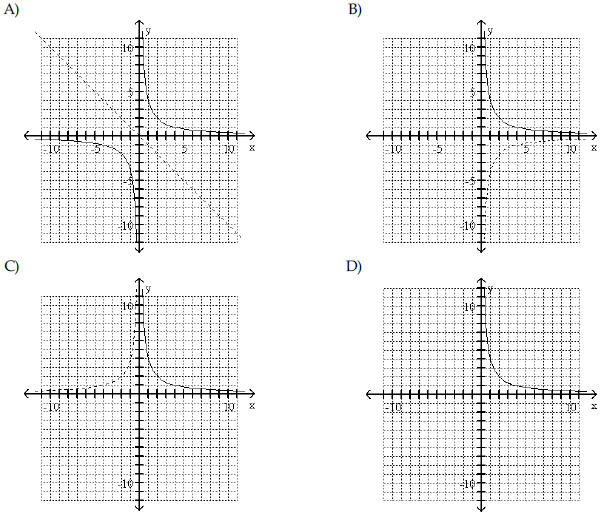 |
 |
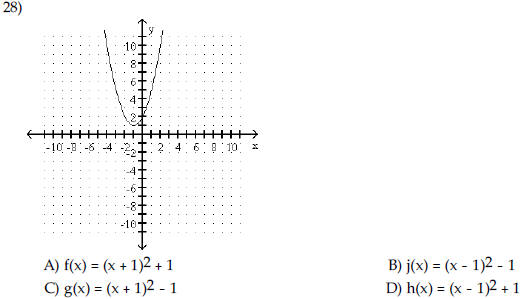
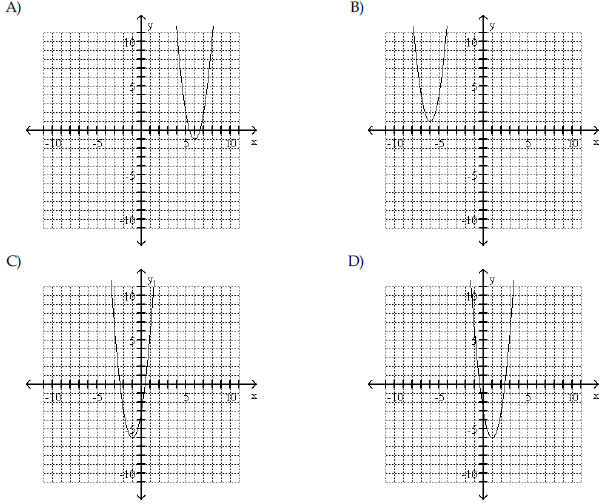
| The graph of a quadratic function
is given. Determine the function's equation.
|
 |
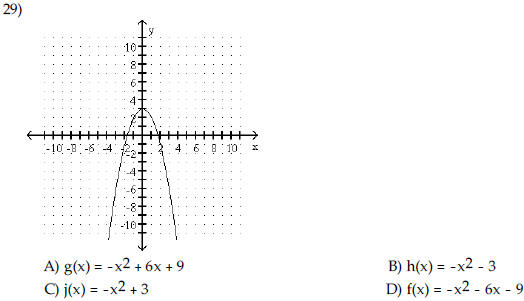 |
 |
| Find the coordinates of the vertex
for the parabola defined by the given quadratic function.
|
 |
 |
 |
| Find the range of the quadratic
function.
|
 |
| Find the y- intercept for the graph of
the quadratic function.
|
 |
| Find the domain and range of the
quadratic function whose graph is described.
34) The vertex is (1, -2) and the graph opens up.
|
 |
| 35) The minimum is -5 at x = -1. A) Domain: (-∞, ∞) Range: (-∞, -5] B) Domain: [-1, ∞) Range: [-5, ∞) C) Domain: (-∞, ∞) Range: [-1, ∞) D) Domain: (-∞, ∞) Range: [-5, ∞) |
 |
| Use the vertex and intercepts to
sketch the graph of the quadratic function.
|
 |
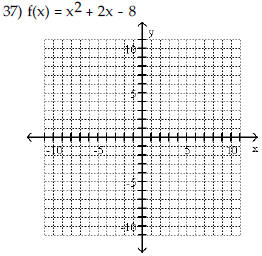 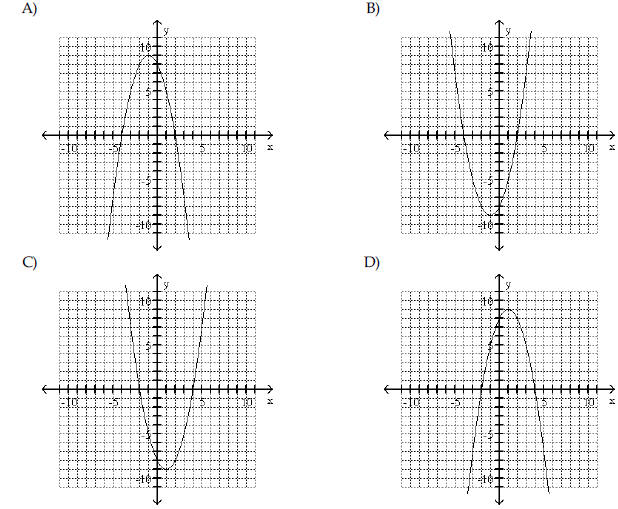 |
 |
| Determine whether the given
quadratic function has a minimum value or maximum value. Then find the
coordinates of the minimum or maximum point.
A) minimum; |
 |
 A) maximum;  B) minimum;  C) minimum;  D) maximum;  |
 |
| Prev | Next |

