Math 121 Review Exam 1
1. Consider the points (0,-3) and (4,-1). Find the equation of the line (in
point-slope form)
passing through the two points . Also, find the equation of the line perpendicular
to this line
passing through the second of these points. Sketch a graph of these two lines.
2. Suppose that a 43 lb dog has a temperature of 102°F.
Write the weight and temperature of this
dog in kilograms and degrees Celsius. (Note that 1 kg = 2.2046 lb.)
3. Consider the functions.

Find the coordinates of the x and y -intercepts for both functions. Find the
slope of the line and the
coordinates for the vertex of the parabola . Determine the coordinates for all
points of intersection
and sketch the graph.
4. Consider the functions f(x) = x-3 and g(x) = x^2-4x-3. Sketch the graphs
of these functions.
Include the coordinates of x and y- intercepts for both functions and the vertex
of the parabola .
Find the points of intersection.
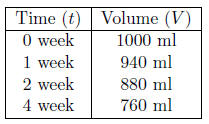
5. The table below shows evaporation of water from a beaker. Initially, there
is one liter. The loss
by evaporation is linear. Find the equation of the line for V as a function of
t. Determine when all
the water is lost. Graph this function for all t when there is water in the
beaker.
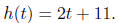
6. The following growth data were recorded for the height of a plant.
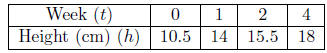
A linear model is proposed for the growth of this plant and has the form
a. Find the sum of squares error between the data and the model. Sketch a
graph of the model
with the data points. Is the model reasonable?
b. Use the model to predict the height of the plant at 3 and 5 weeks.
7. For animals that reproduce seasonally, we find that their population satisfies a difference equation
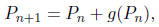
where Pn is the population in the nth season and g(P) (in individuals per
generation) is the growth
rate of the population.
a. Suppose that the growth rate g(P) satisfies the quadratic equation
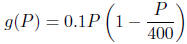
The population is at equilibrium when the growth rate is zero . Find the equilibrium populations.
b. The growth rate is at a maximum at the vertex of
parabola. Find the population that
produces this maximum growth rate and what that growth rate is.
c. Sketch a graph of this growth rate function.
8. A rectangle with a length x and width y has a perimeter of 20 cm.
a. Write an expression for the width y as a function of the length x, using this information.
b. The area of a rectangle is A = xy. Substitute the
expression for y into this formula for the
area to produce a function of the area as a function of x alone. What is the
domain of this function?
c. Sketch a graph of the area as a function of x and
determine what value of x produces the
largest area. What curve is produced by A(x)?
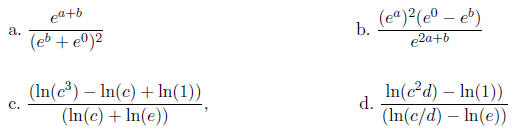
9. Suppose that ea = 2.2 and eb =
0.7. In addition, assume that ln(c) = 1.3 and ln(d) = -0.5. Use
the properties of exponentials and logarithms to evaluate the following.
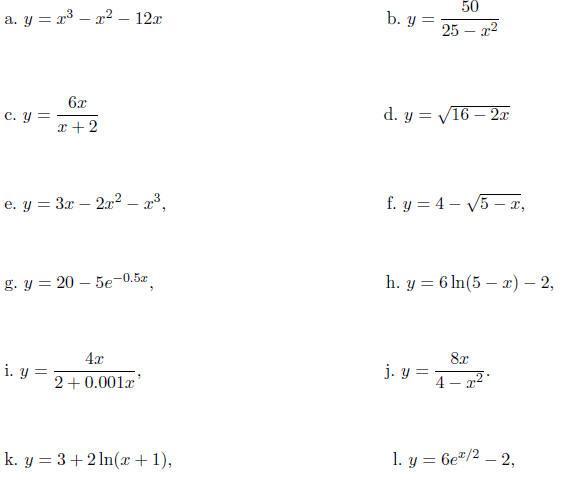
10. For each of the following functions, give the domain.
Find the x and y-intercepts, and determine
all vertical and horizontal asymptotes for each of these functions, then sketch
a graph.
11. You are given the following data on the heights and
lengths of several breeds of dogs. The
height is measured at the shoulder (in cm) and the length is from the nose to
the anus (in cm).
| Breed | Height (H cm) | Length (L cm) |
| Chihuahua | 18 | 33 |
| Beagle | 36 | 81 |
| Labrador Retriever | 55 | 102 |
| Irish Setter | 66 | 115 |
A linear model is proposed for the relationship between
the length, L, and the height, H, of the
following form.
L(H) = 1.7H + 10
a. Find the sum of squares error between the data and the
model. Which breed is furthest from
the model?
b. Use the model to predict the length of a Borzoi, which
has a shoulder height of 81 cm. Also,
use the model to predict the height of a Border Collie, which has a length of 85
cm.
12. The Lambert-Beer law for absorbance of light by a
spectrophotometer is a linear relationship,
which can have the form
A = mc,
where c is the concentration of the sample, A is
absorbance, and m is the slope that must be
determined from experiments.
a. Below are data collected on samples from a collection of urea standards using a urea indicator.
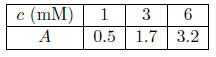
Write a formula for the quadratic function J(m) that
measures the sum of squares error of the line
fitting the data. Find the vertex of this quadratic function. This gives the
value of the best slope
m, while the J(m) value of the vertex gives the least sum of squares error.
b. Use this model (with the best value of m) to determine
the concentration of urea in an
unknown sample with absorbances of A = 2.2.
13. An underwater ecological study is made easier by
photographing the region, then measuring
distances on the picture. The picture is taken from above a flat rock reef. The
diver measures
three reference objects to help him with his study. One distinctive rock is 1.2
meters and measures
2.0 cm on the picture. Two kelp plants are separated by 2.5 meters, which is 4.0
cm on the picture.
A sand bar is 3.6 meters across and measures 6.1 cm in the picture.
a. The conversion of measurements in the photo p to
measurements in actual distance d is given
by the formula
d = kp.
Write a formula for the quadratic function J(k) that
measures the sum of squares error of the line
fitting the measurements in the photo. Find the vertex of this quadratic
function. This gives the
value of the best slope k, while the J(k) value of the vertex gives the least
sum of squares error.
b. In the photograph, there is a picture of a leopard
shark that measures 2.2 cm. How long is
this shark?
c. How long would a 2.0 m shark appear in the picture?
14. The poultry industry has accumulated detailed data on
the consumption of feed by chickens.
The reference Nutritional Requirement of Chickens (1984), you are given that a
560 g chicken
consumes 390 g of feed per week. A 2520 g broiler consumes 1210 g of feed per
week.
a. Assume linear relationship between the weight of the
chicken (W) and the amount of feed
(F) that it consumes
F = mW + b.
Use the data above to find the constants m and b in the model above.
b. Assume there is a power law relationship between the
weight of the chicken (W) and the
amount of feed (F) that it consumes

Use the data above to find the constants a and k in the power law or allometric model above.
c. Use both models (linear and allometric) to find the
amount of feed consumed by a 1000 g
chicken. Also, estimate the weight of a chicken that consumes 500 g of feed
using both models.
Which model gives the better predictions and why?
15. Experimental measurements show that when current is
applied to samples of a tissue, the
resistance measured by a voltmeter yields the thickness, T. Suppose a 3 mm
sample of tissue
causes a voltage drop, v, of 0.25V, and a 4 mm sample of tissue causes a voltage
drop of 0.45V.
a. A linear model is given by T = mv + b for some
constants m and b. Find the constants m
and b and sketch a graph of this model. Use this model to predict the voltage
drop for a tissue that
has a thickness of 2 mm. Also, find the thickness of a tissue that gives a
voltage drop of 0.6V.
b. If the thickness of the tissue satisfies a power law
with respect to resistance measured by the
voltage drop, then the model is given by

Find the constants k and a and sketch a graph of this
model. Use this model to predict the voltage
drop for a tissue that has a thickness of 2 mm. Also, find the thickness of a
tissue that gives a
voltage drop of 0.6V.
c. Which model do you expect is better and why?
| Prev | Next |