Polynomials
A review for Calculus I
A polynomial in the variable x is a sum of powers of x
multiplied by coefficients . For example, p(x) = x5 + 2 x4 - x3 - 3 x + 42 is
a polynomial. More generally, a function of the form

is a polynomial. The number n is called the degree or the
order of the polynomial and the numbers
 are the
coefficients. The symbols simply represent numbers. In the example above, we
have n = 5, a5 = 1, a4 = 2, a3 = -1, a2 = 0,
a1 = -3, and a0 = 42. Of particular interest for us are first order
polynomials, whose graphs are straight lines, and second order
polynomials, whose graphs are parabolas.
Note that we will interchangeably use notations such as y
= x3 + 1, f (x) = x3 + 1, or p(x) = x3 + 1. The first might emphasize that
we want to graph in xy- coordinate space . The second might emphasize that we are
dealing with a function, while the last emphasizes
that we are dealing with a polynomial.
I want to emphasize that I absolutely expect that you
understand the basics of polynomials. You should be able to graph first and
second order polynomials quickly and easily, without the use of a graphing
calculator . Your graphs should incorporate concepts
such as slope, intercept, and vertex. This document reviews the basics of these
ideas.
First order polynomials
A first order polynomial is a polynomial of degree one.
Thus, it can be written p(x) = mx + b. I expect folks to know, or understand
soon, that the graph of this equation is a line with slope m and y- intercept b .
We can use this to quickly graph such an
expression . For example, the graph of y = 2 x - 1 has slope 2 and y-intercept
-1. It is very easy to graph from this information.
(Note the x and y scales.)
Conversely, we might need to find an equation when given a particular graph or other geometric information.
Example:
Find the equation of the line with slope 8 and y-intercept 2.
Solution :
Well, according to the interpretation above, this should be y = 8 x + 2.
Well, according to the interpretation above, this should
be y = 8 x + 2.
Now how hard was that? More generally, we might need the equation of a line
through an arbitrary point, which is not necessarily
an intercept. In this case, the point-slope formula comes in handy, namely, the
equation of a line through the point (x0, y0)
with slope m is y - y0 = m(x - x0). (Note that this simply states that the
slope m = (y - y0) / (x - x0) is independent of the particular
point (x, y) on the line; this is exactly the defining characteristic of a line
- constant slope!)
Example:
Find the equation of the line through the points (1, 2) and (3, 5)
Solution:
We can choose either point given as our (x0, y0); the slope can be
computed from the two points. Thus,
m = (5 - 2) / (3 - 1) = 3 / 2 and an equation of the line is
Note that the “simplification” is not strictly necessary.
Second order polynomials
A second order polynomial has the form y = ax2 + bx + c
and is frequently called a quadratic. We assume that a ≠ 0 to make
sure that this is genuinely a quadratic. The graph of any quadratic is a
parabola that is easy to sketch once you locate it's vertex
and intercepts. We'll show that this is always true by first considering the
basic function f (x) = x2, then relating the graph of any
quadratic back to this base case. I assume that everyone knows that the graph of
f (x) = x2 is a parabola; this comes from simply
plotting some points as in the following table.
If we simply plot these points, we get the graph below on
the left; if we assume continuity and connect the dots, we get the graph
below on the right. That's our basic parabola.
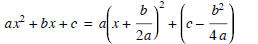
Now, what about the more general quadratic y = ax2 + bx + c? We can relate this back to the basic formula by writing
 (1)
(1)
This formula can be verified by simply expanding the
expression on the right and simplifying. Note that we can now see that the
general quadratic is simply a shifted (horizontally and vertically), stretched
(or compressed), and possibly reflected copy of the
basic parabola. Its vertex is at the point where x = -b / (2 a). It's not really
necessary to commit the more complicated
c - b2 / (4 a) expression to memory, since we can always just plug the
x-coordinate of the vertex back into the original equation to
get the y-coordinate. The sign of a indicates whether the parabola is opening up
or down.
Example:
Sketch the graph of y = 2 x2 + 8 x + 11.
Solution:
The vertex of the parabola is at
 The parabola opens up, since the coefficient
of x2 is positive and the y-intercept is 11. From this information, it is very
easy to sketch the graph.
Example:
Plot the graph of y = 2 + 3 x - x2.
Solution:
The parabola opens down, the vertex of the parabola is at x = -3 / (2 (-1))
= 3 / 2 and the y-intercept is 2. Again, it is very easy to
make a rough sketch of the graph from this information.
Note that there are a few little tricky points, however.
Namely, what are the x-intercepts and what is the exact height of the
vertex. They are simple to answer but require a bit of computation. The
y-coordinate of the vertex is
y(3 / 2) = 2 + 3 (3 / 2) - (3 / 2)2 = 2 + 9 / 2 - 9 / 4 = 17 / 4,
which is a little bigger than 4. We can find the
x-intercepts using the quadratic formula, namely the roots (or zeros) of
y = ax2 + bx + c are
The quadratic formula follows by setting our re-written
quadratic in formula (1) equal to zero and solving for x. Simply applying
the quadratic formula in this case yields
 These are the question marks in the graph above.
It's worth mentioning that very often only a rough sketch is needed and these
computations aren't necessary.
| Prev | Next |