Graphing Linear Equations
6.2 Graphing linear equations
Equations with only variable and with no exponents have
only one solution.
E.g. 2x – 1 = -5
The only solution is x=-2
However, linear equations, which are equations with two
variables and no exponents , have an infinite number of
solutions .
How about 2x - 3y = 6 ?
What values of x and y make this equation true?
Well, you could have x=- and y = -2 [2(0) – 3(-2) = 6]
Or you could have x=-3 and y = -4 [2(-3) – 3(-4) = -6+12 = 6]
And so on and so on. There are too many to name. We can
state the solution by graphing it.
How do you graph an equation like 2x – 3y = 6?
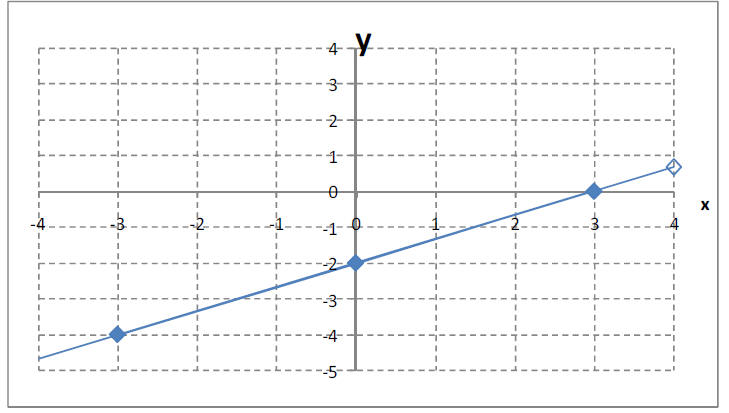
Linear equations have a dependent variable and an
independent variable. In
general, x is the independent variable and y is the dependent variable. When
a linear equation is re-written so that y is on one side and x is on the other,
the value of y depends on the value chosen for x.
How to graph a linear equation:
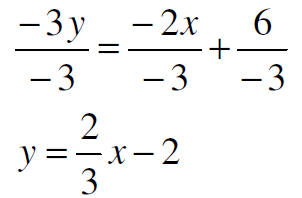
Step 1) Re-arrange the equation so that y is isolated.

(even though we added 2x to 6 it is “proper” to
place the variable term before the constant term.)
Now divide both sides by -3 to get y by itself.
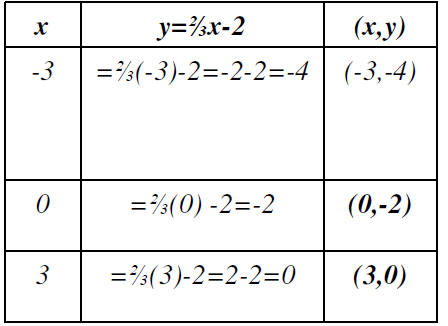
Step 2) Set up a table of ordered pairs and choose x’s,
then find out what
the y’s need to be. You only need two ordered pairs to draw a line, but three
helps it to be more accurate. When choosing x’s, try to pick ones that will
come out with an integer
when multiplied by the coefficient
in your linear equation.
Now that you have three ordered
pairs, just plot them on a graph and
connect the dots!
Some times it ’s hard to choose x’s that will give you a
nice integer
for y. An alternative method is using the slope and intercept of the
line.
Graph 2y – x = 2
Get y by itself by first adding x to both sides

Divide both sides by 2

Once y is isolated, it is now in what is called the
“slope- intercept form .”
y = mx + b, where m re presents something called the slope and b
represents the y-intercept.
The slope of the line tells you how much it is slanted.
The y-intercept is
the point where the line crosses the y-axis. At that point x=0 and y is the
constant.
In this case, the slope is ½
and the y-intercept is 1
[or more specifically (0,1)]
A slope of ½ means that from any
point on the line, the line
rises vertically 1 unit and
“runs” horizontally 2 units.
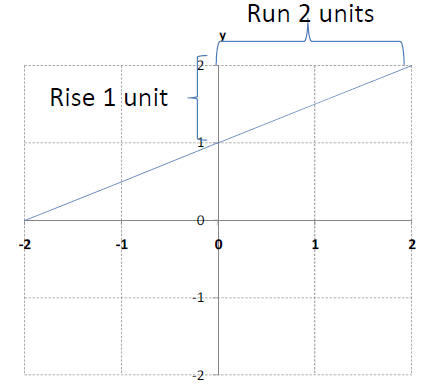
We know right away that one point on the line is the
y-intercept: (0,1).
So we can start at that point and rise 1 unit and then run 2 units to land
at another point on the line (2,2).
Slopes tell you immediately about the steepness and direction of a line.
A slope that is positive points up and to the right
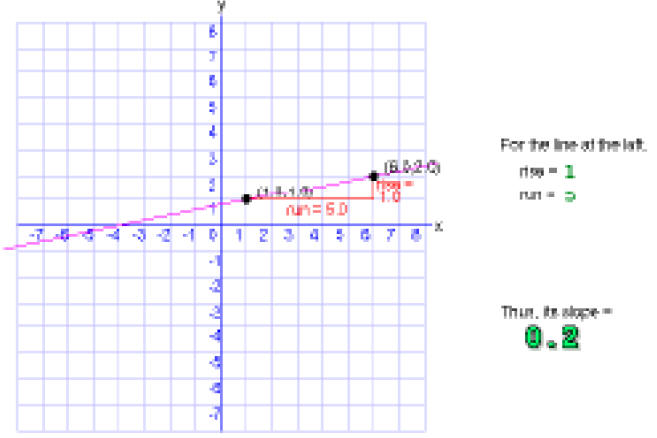
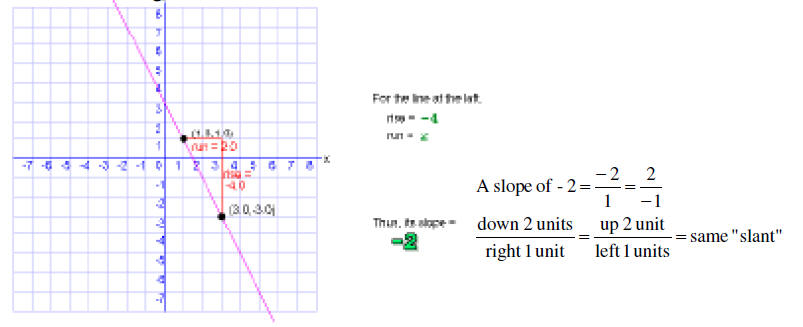
A slope that is negative points down and to the right.
If the rise is negative, the vertical rise in a downward direction.
If the run is negative, the horizontal “run” is to the left.
 A slope whose absolute
value is a fraction less than 1 is closer to being
horizontal.
A slope whose absolute value is greater than one is steeper and closer to being
vertical
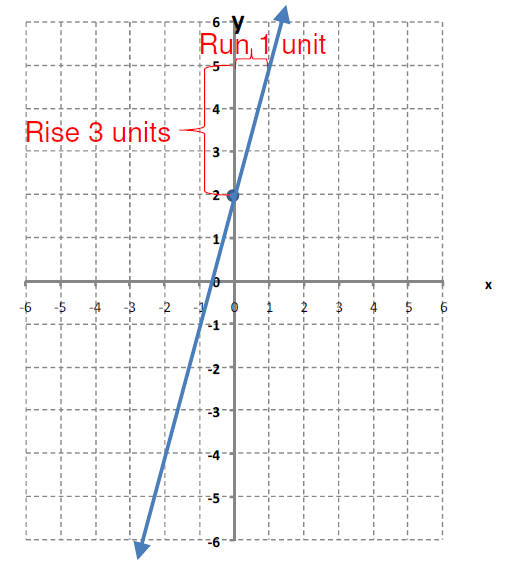
Graph y = 3x – 2
This is already in slope-intercept form.
The slope is ____
The y-intercept is (0,__)
| Prev | Next |
