Graphing Quadratics Using the TI-83
Unit Objectives
1. Students will be able to solve quadratic equations using the quadratic
formula.
2. Students will be able to identify and use the properties of quadratic
equations.
3. Students will be able to use quadratic equations to solve problems about
paths of
projectiles.
4. Students will be able to graph equations of the form y = ax2 + bx + c.
New York State Standards: ( Math A )
2A Understand and use rational and irrational numbers.
3A Use addition, subtraction, multiplication, division and exponentiation with
real
numbers and algebraic expressions .
7A Represent and analyze functions using verbal descriptions, tables, equations,
and
graphs.
7B Apply linear and quadratic functions in the solution of problems.
7C Translate among the verbal descriptions, tables, equations, and graphic forms
of
functions.
7D Model real -world situations with appropriate functions.
NCTM Standards:
• Numbers and Operations
• Algebra
• Communication
• Representations
Materials and Equipment Needed
• UCSMP Algebra Text
• Class Set of TI-83 Calculators
• Overhead with Calculator unit
• Computers with internet access
Overview:
Day1:
Students will be assigned group projects that will be one assessment. Students
will use
TI-83 graphing calculators to explore variations of y = ax2.
Day 2:
Students will explore graphing y = ax2 + bx + c on the website Exploremath.com.
Day 3:
Students will work with partners on Lesson Master 9-3B, Graphing with an
Automatic
Grapher. (TI-83)
Day 4:
Student will explore real-world examples of parabolas.
Day 5:
Students will solve quadratic equations both with Quadratic Formula and PolySmlt
App
on the TI-83.
Day 1
Lesson Plan:
Objectives:
1. Students will be able to graph and interpret equations of the form y = ax2.
2. Students will be able to recognize axis of symmetry from a table of values
and
from a graph.
3. Students will be able to solve equations of the form ax2 = k.
Standards:
• NCTM Standards covered: Algebra, Representation
• NYS Standards covered: 3A, 7A, 7C
Materials:
• Graphing calculators
• Student worksheet and overhead transparency of worksheet
• Overhead with calculator unit
Opening Activity:
Students will be given a card with a number 1 – 7 on it when they enter the
room. There
will be four of each card. These represent project numbers on pgs. 605 – 606.
The
students will be given 10 minutes to meet with their group members to discuss
the
project, which will be due the day after the unit test. This will be one of the
assessments.
Developmental Activity:
Students will return to their seats and work with their partners to complete the
worksheet,
Exploring y = ax2. Students will then be selected to present their solutions to
the class
either at the board or on the overhead TI-83 unit.
Ticket Out:
Students will have the last 5 minutes of class to respond to the following
question, also to
address any concerns they had with the lesson.
What are the two most important pieces of information that are determined by the
a in the
equation y = ax2?
Homework:
Read pgs. 548 – 551, complete pgs. 551-553 # 5 – 9, 12, 13.
Teacher’s Notes:
Solutions to Developmental Activity:
#1 and #2:
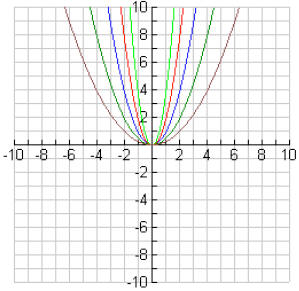
#3: Answers will vary
#4 and #5:
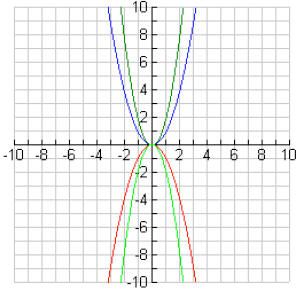
#6: Answers will vary
Ticket Out:
Answers will be collected as the students exit the room. The information will be
used to
assess the students understanding of the lesson covered.
Solutions to Homework:
5b.
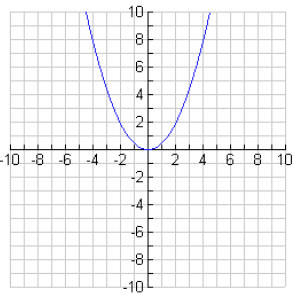
5c. A parabola which opens up whose axis of symmetry is x
= 0 and whose vertex is
(0,0).
6b.
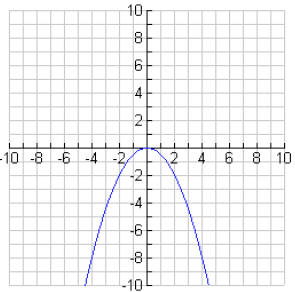
6c. A parabola which opens down whose axis of symmetry is
x = 0 and whose vertex is
(0,0).
7. (0,0)
| 8. x = 0 | 12. 144 ft. |
| 9. up, down | 13. 100 ft. |
Exploring y = ax2
Name: ____________________
Period: _____
Directions: With your partner complete the following questions using your
graphing
calculator to create graphs.
1. Graph the following equations in the y = window and use zoom standard to view
the
graphs.
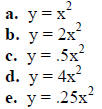
2. Sketch the graphs on the grid below.
3. What happens to the graph of y = ax2 when the value of a gets larger? gets smaller?
4. Graph the following equations in the y = window and use
zoom standard to view the
graphs.

5. Sketch the graphs in the grid below.
6. What happens to the graph of y = ax2 when a changes positive to negative?
Day 2
Lesson Plan:
Objectives:
1. Students will be able to interpret the graphs of equations of the form y =
ax2 + bx
+ c.
2. Students will be able to identify the vertex, axis of symmetry, y-intercept,
and xintercept(
s) if they exist.
Standards:
• NCTM Standards covered: Algebra, Representation
• NYS Standards covered: 7A, 7C
Materials:
• Computers with internet access
• Worksheets for students
Opening Activity:
Students will enter computer lab, take their seats, and log in to the computers
as
previously instructed . They will given a worksheet as they enter, it will have
the website
they have to find.
Developmental Activity:
Students will use the website to answer the questions on the worksheet regarding
the
graph of y = ax2 + bx + c.
Ticket Out:
Students will have the last 5 minutes of class to respond to the following
question, also to
address any concerns they had with the lesson.
What happens to the graph of y = ax2 + bx + c when the value of c changes?
Homework:
Read pgs. 554 – 557, complete pgs. 558 – 559 #5, 7, 9, 12
| Prev | Next |