High School Math A & B
7D.
Explain the similarities and differences in the equations that might be used for
each of the following graphs.

7E.
About Decay
Start this experiment with one cupful of M & M’s. Shake the cup and pour the M &
M’s onto the napkin. Count the total
number of M & M’s. Write this as the number for trial #1. Then remove all M &
M’s that have the M showing. Record
the total number left in the table below. Using the new total of M & M’s each
time, repeat the procedure five more times .
Note if the number of M & M’s reaches zero at any trial, the experiment is over
at that time and you should not use the
zero result as part of your data.
Create a scatterplot of Trial for x and total Number for y.
Enter the data in lists using your graphing calculator .
Write the equation:
Graph the exponential function on the grid above.
Use the equation to predict the number of M & M’s you would have had two times before trial #1:
If there were a larger number of M & M’s before trial #1, use the equation to
predict the trial when there were 900 M &
M’s (a negative number ):
Explain the coefficients a and b in the equation .
7F.
Given f (x) = x2 - 2x
A. Determine an expression for h (x), if h (x) = f (-x).
B. Determine an expression for g (x), if g(x) is represented by the rotation of
180° of f (x) about the origin.
C. Rotate f (x) 90° about the origin. Find the coordinates of the point(s) for
which x = -1, under the rotation.
7G.
Nita Pass is about to study for a mathematics exam . Nita knows that the test
grade is a function of the number of hours
studied and knows from past experience that 1 hour of studying will result in a
grade of 60; 2 hours, in a grade of 74;
and 7 hours in a grade of 84.
Show Nita that the grade is not a linear function of the number of hours studied.
Assume that the grade varies quadratically with the number of hours studied.
Find the equation for the function, and
draw the graph (show important features: vertex and intercepts).
What is the minimum amount of study time needed to pass the test if the lowest
passing grade is 70? What is the gradeintercept
and what does it represent in the real world?
The quadratic model predicts that Nita could earn zero points on the test. What
might happen in the real world that
could actually cause her to score zero by studying this long?
Use the graph to show that there is no real value of time for which the grade will be 100.
7H.
Conjecture:
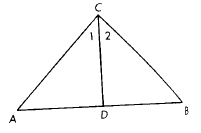
The angle bisector of the vertex angle of an isosceles triangle is also a median
to the
base.

Given:
Isosceles ∆ABC with
 and with
 an angle bisector of vertex angle C.
Show:
 is a median to the base.
Two-column proof:
7I.
Solve the following equation for x: 2x2 + 5x - 1 = 0. Sketch the graph of the
function y = 2x2 + 5x - 1. Explain the relation
between the roots of the equation and the x- intercepts of the graph of the
function. [Also 3D., 4A., 6A., and 7C.]
7J.
The area A and perimeter P of a square are functions of its side length S.
Express the area as a function of the perimeter.
7K.
The time it takes for a pendulum to swing back and forth once depends only on
the length of the pendulum. This period
T seconds is given by the formula, where l is the length of the pendulum in
meters. By what factor is the
period increased when the pendulum length is tripled?
7L.
Provide students with examples of Escher prints and have them identify two
congruent shapes and the isometries that
provide the congruence. [Also 4J.]
7M.
Note the tessellations below, using capital block letters T and E. Have students
work in
groups to:
-determine what transformations were used in these tilings.
-identify those that are direct or indirect isometries.
-determine what other capital block letters would tile a plane.
-use graph paper to create their tessellations and make a list describing their
findings.
7N.
Graph each of the relations below, its inverse, and y = x on the same coordinate
system . Which of the four relations are
functions? Which of the inverses are functions?
g: y = 2x - 2
f: y = -1/2x + 2
p: y = x2 + 1
q: y = (x+2)2
7O.
Find, if it exists, a line of symmetry of the graph of each equation. If there
is no line of symmetry, write none.
y = x2 + 5
y = x2 + 4x + 1
y = x
7P.
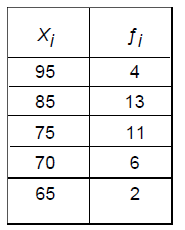
The table below shows the scores on a writing test in an English class:

A. Using the accompanying set of data, find both the mean and the standard
deviation to the nearest tenth.
B. What is the number of scores that fall within one standrad deviation of the
mean?
C. Find, to the nearest tenth, the percentage of scores in this set of data that
are within one standard deviation
of the mean?
D. What is the number of scores that fall within two standard deviations of the
mean?
E. Find, the percentage of scores in this set of data that are within two
standrad deviations of the mean.
7Q.
Find all positive values of A less than 360° that satisfy the equation 2 cos 2A
- 3 sin A = 1. Express your answers to the
nearest ten minutes or nearest tenth of a degree.
| Prev | Next |