College Algebra Exam 3
Exam Questions
Read Carefully! You have until Monday (10/13/08) to complete the quiz. The quiz
is due at the
beginning of class on Monday (10/13/08). Late quizzes are not accepted.
This quiz is open notes, open book. This includes any supplementary texts or
online documents.
You must answer all of the exercises on your own. You are not allowed to work in
groups or pairs
on the quiz. You are not allowed to enlist the aid of a tutor or friend to help
with the quiz. You
are not allowed to read the exercises in the quiz, then seek help on similar
questions. Once you
open the quiz and read the questions, you may not seek any outside help of any
kind.
Whenever you feel the need to explain or justify a step , do so in good prose.
Write a sentence
or two of explanation .
When working in the Mathlab, please do not work next to any other student who is
also working
on the quiz. For the sake of propriety, please separate yourselves when working
on the quiz in the
Mathlab.
Place your solutions on graph paper. On a good sheet of paper, write out
(longhand) and sign
the following honor pledge.
I promise that all work found herein is my own. I have received no help from
tutors,
colleagues, or other teachers. I also promise that I have refrained from sharing
my work
and ideas with other students in the class. I have also honored all of the quiz
constraints
listed in the directions.
Arrange your solutions in order, place these quiz page(s) on top of your
solutions, then place the
honor pledge on top of the quiz as a cover sheet. Staple. Good luck!
Exercise 1. David and Liz are hanging masses from a spring in the physics
lab. They record the
distance each mass stretches the spring in a table.

(a) Set up a coordinate system on a sheet of graph paper. Label and scale each
axis. Place x,
the distance stretched on the vertical axis. Place m, the mass, on the
horizontal axis. Be sure
to include the units with your labels. Plot the data points from the table on
your coordinate
system, then use a clear plastic ruler to draw the "line of best t."
(b) Pick two points on your line of best t that are not data points. Use a
different marker style
to differentiate these points from the original data points (maybe a 'cross'
instead of a 'dot').
Use your graph to estimate the coordinates of these points. Label each point
with its estimated
coordinates.
(c) Use the two estimated points from part (c) to determine the slope of the
line of best t. Include
units with your answer. Write a sentence that explains the real -world meaning of
the slope in
this example. Be sure to include the units in your sentence.
(d) Use the point-slope form y -y0 = m(x-x0) of the line to determine the
equation of the line of
best t. Replace y with x and x with m and solve for x in terms of m. Label the
line of best
t with the resulting equation.
(e) Load the data into your calculator and use the linear regression routine in
your calculator to
determine the equation of the line of best t. Label your line of best t with
this second
equation.
Exercise 2. Consider the quadratic function f(x) = -x2 -
4x + 4. Perform each of the following
tasks.
(a) Use the method of completing the square to put the quadratic function in
vertex form. On
graph paper, plot and label the vertex of the parabola with its coordinates.
Draw the axis of
symmetry as a dashed line and label it with its equation.
(b) Find the exact values of the x - and y-intercepts. Use a calculator to
approximate each, correct
to the nearest tenth. Plot each intercept using the approximations but label
each intercept
with its exact coordinates ( no decimals ).
(c) Sketch the parabola represented by the quadratic function, label it with its
equation, then use
set-builder and interval notation to describe the domain of the quadratic
function.
Exercise 3. Use the shortcut to determine the minimum value of the quadratic
function f(x) =
2x2-4x-8. State the minimum value of the function f and the x-value at which it
occurs. Finally,
use interval notation to describe where the function f is increasing or
decreasing.
Exercise 4. Consider the polynomial function
p(x) = (x + 1)2(x - 2)(x - 5):
Perform each of the following tasks.
(a) State the end-behavior of the polynomial using limit notation taught in
class.
(b) State the zeros of the polynomial and their multiplicities. Plot each
x-intercept on graph paper
and label each with its exact coordinates.
(c) Draw a number line on your exam and place upon it the zeros of the
polynomial. Create a
table like those shown in your text, then identify the value of the function at
a point from each
interval delimited by the zeros. Plot these points on your graph.
(d) Sketch the graph of p.
(e) Shade the solution of p(x)≥ 0 on the x-axis of your plot and describe it
using interval notation.
Exercise 5. Determine the end-behavior, in the form of asymptotes, of each of
the following
rational functions. Use limit notation taught in class.

Exercise 6. Consider the rational function
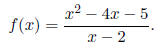
Perform each of the following tasks.
(a) State the zeros of the function. Plot the x-intercepts of the function on
graph paper and label
them with their exact coordinates.
(b) State the vertical asymptote of the function, plot it as a dashed line on
your graph, then label
it with its equation.
(c) Find the oblique (slant) asymptote using long division. Plot the result on
graph paper and
label it with its equation.
(d) Plot one or two points each side of the vertical
asymptote for accuracy, then sketch the graph
of the rational function.
(e) Shade the solution of f(x) < 0 on the x-axis of your plot and use interval
notation to describe
your soluton.
| Prev | Next |