Equations
Equations, functions and graphs
Chapter Goals:
• Identify solutions to an equation .
• Solve an equation for one variable in terms of another .
• What is a function?
• Understand function notation.
• Find inverse functions.
• What is a graph?
• Sketch the graph of an equation in two variables.
• Find the equation of a line and a parabola .
• Find the intersection point(s) of two graphs.
Assignments:
Assignment 00 (Due date: Jan. 20) Assignment 01 (Due date: Jan. 22)
Equations and solution(s) to equations:
One way in which humanity increases its understanding
of the universe is by discovering relationships between various objects,
concepts, quantities, and so on. Our
understanding of a relationship between two quantities is sharpest when this
relationship can be completely
quantified and expressed in an equation. Roughly speaking, an equation is
a statement that two mathematical
expressions are equal . For instance, x3 − 2xy + y2 = 5 is
an equation relating x and y. A set of numbers that
can be substituted for the variables in an equation so that the equality is true
is a solution for the equation.
A solution is said to satisfy the equation.
Example 1:
Is x = 1 and y = 2 a solution for the equation x2 + y = 2xy? What about x = 1 and y = 1?
Many problems in the sciences, economics, finance,
medicine and numerous other fields can be formulated into
algebraic terms by identifying variables expressing unknown quantities and by
setting up appropriate equations
relating these variables.
Example 2:
Suppose a fuel mixture is 4% ethanol and 96% gasoline. How
much ethanol (in gallons) must
you add to one gallon of fuel so that the new fuel mixture is 10% ethanol?
Equations into functions:
An equation in two (or more) variables can sometimes be
solved in terms
of one of the variables. This type of equation is closely related to the notion
of a function.
Example 3:
Solve the equation x3 + 2xy + 5y = 7 for y in terms of x.
Observe that in the equation
 the expression on the right-hand side can be
viewed as a recipe that
the expression on the right-hand side can be
viewed as a recipe that
associates to any given value of x precisely one corresponding value for y.
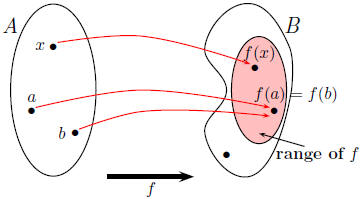
Definition of function:
A function f is a rule that assigns to each element
x in a
set A exactly one element, called f(x), in a set B.
The set A is called the domain of f whereas the set B is
called the codomain of f; f(x) is called the value of f at
x, or the image of x under f.
The range of f is the set of all possible values of f(x) as x
varies throughout the domain: range of f = {f(x) | x ∈ A}.
Arrow diagram of f
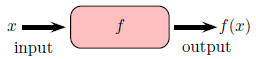
Machine diagram of f
Evaluating a function:
The symbol that represents an arbitrary number in the
domain of a function f is
called an independent variable. The symbol that represents a number in
the range of f is called a dependent
variable. In the definition of a function the independent variable plays the
role of a “placeholder”. For example,
the function f(x) = 2x2 − 3x + 1 can be thought of as
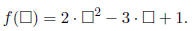
To evaluate f at a number (expression), we substitute the number (expression) for the placeholder.
Note:
If f is a function of x, then y = f(x) is a special kind
of equation, in which the variable y appears
alone on the left side of the equal sign and the expression on the right side of
the equal sign involves only the
other variable x. Conversely, when we have this special kind of equation,
such as y = ex + x3 − 3x + 5, it
is common to think of the right hand side as defining a function f(x), and of
the equation as being simply
y = f(x).
Example 4:
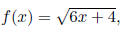
Find the domain of the following functions:

Example 5:
 write an expression for:
Example 6
If P(x) = 3x3+ 2x2 + x + 11 and we
rewrite P(x) in the form
P(x) = A + B(x − 1) + C(x − 1)(x − 2) + D(x − 1)(x − 2)(x − 3),
what are the values of A and B?
Example 7:
If we rewrite the function
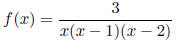 in the form:
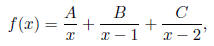
what are the values of A, B, and C?
Inverse of a function:
Recall that two functions f(x) and g(x) are said to be
inverse of each other if
f(g(x)) = x and g(f(x)) = x.
Example 8:
If h(t) = 3t + 7, find a function g(t) such that h(g(t)) = t.
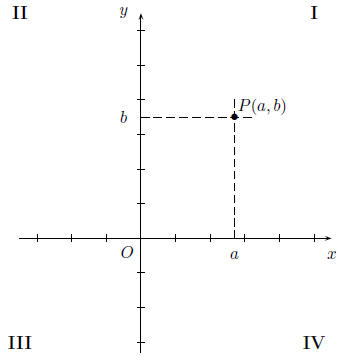
Cartesian plane and the graph of a function:
Points in a plane can be identified with ordered pairs of
numbers to
form the coordinate plane. To do this, we draw two perpendicular
oriented lines (one horizontal and the other vertical) that intersect
at 0 on each line. The horizontal line with positive direction to
the right is called the x-axis; the other line with positive direction
upward is called the y-axis. The point of intersection of the two
axes is the origin O. The two axes divide the plane into four
quadrants, labeled I, II, III, and IV.
The coordinate plane is also called Cartesian plane in honor of the
French mathematician /philosopher Ren´e Descartes (1596-1650).
Any point P in the coordinate plane can be located by a unique
ordered pair of numbers (a, b) as shown in the picture. The first
number a is called the x-coordinate of P; the second number b is
called the y-coordinate of P.
Graphing functions:
If f is a function with domain A, then the graph of f is
the set of ordered pairs
graph of f = {(x, f(x)) | x ∈ A}.
In other words, the graph of f is the set of all points
(x, y) such that y = f(x); that is, the graph of f is the
graph of the equation y = f(x).
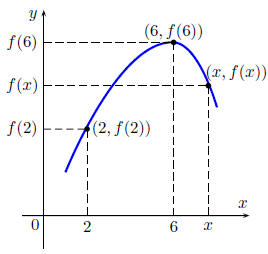
Obtaining information from the graph of a function:
The values of a function are represented by the height of
its
graph above the x-axis. So, we can read off the values of a
function from its graph.
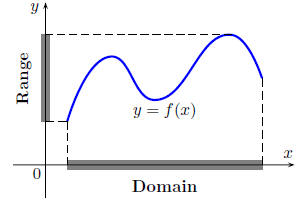
In addition, the graph of a function helps us picture the domain
and range of the function on the x-axis and y-axis as shown in
the picture:
The graph of a function is a curve in the xy-
plane. But the question arises: Which curves
in the xy-plane are graphs of functions?
The vertical line test:
A curve in the coordinate plane is the
graph of a function if and only if no vertical
line intersects the curve more than once.
Graph of a function
Not a graph of a function
Lines and parabolas:
The simplest types of functions are linear and quadratic
functions.
A linear function is a function f of the form f(x) = mx + b, where m and b are
real numbers. The graph of
the equation y = mx + b is a (non-vertical) line in the xy-plane. The numbers m
and b are called the slope
and y-intercept, respectively.
A quadratic function is a function f of the form
f(x) = ax2 + bx + c,
where a, b, and c are real numbers and a ≠ 0.
The graph of any quadratic function is a parabola;
it can be obtained from the graph of f(x) = x2
by using shifting, reflecting and stretching trans-
formations.
Indeed, by completing the square a quadratic
function f(x) = ax2 + bx + c can be expressed
in the standard form
f(x) = a(x − h)2 + k.
The graph of f is a parabola with vertex (h, k);
the parabola opens upward if a > 0, or downward
if a < 0.
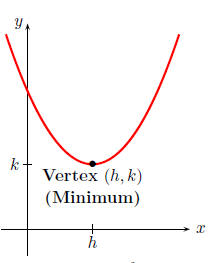
f(x) = a(x − h)2 + k,
a > 0
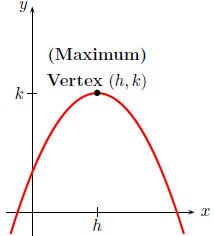
f(x) = a(x − h)2 + k,
a < 0
Example 9:
If the equation of the line through the points (3, 4) and
(−1, 6) is written as
y = A + B(x + 1),
what are the values of A and B?
Example 10:
The parabola y = x2−15x+54 intersects the
x-axis at the two points P and Q. What
is the distance from P to Q?
If we rewrite the inequality x 2 − 15x + 54 < 0 in the form A < x < B,
what are the values of A and B?
Intersection points:
The graphs of two equations intersect at a point if and only if that point is a solution for both equations.
Example 11:
Find the point(s) of intersection between the graph of the
equation 4x2 + 9y2 = 36 and
the line with equation
• y = −2;
• y = 1.
Example 12:
Find all points where the graph of (y − 1)2 − 2
= x crosses
• the y-axis;
• the x-axis.
Example 13:
The area of a right triangle is 7. The sum of the lengths
of the two sides adjacent to the
right angle of the triangle is 11. What is the length of the hypotenuse of the
triangle?
Example 14:
What is the smallest root of the polynomial Q(x) = x3 − 12x2 + 44x − 48?
| Prev | Next |