Inverse Functions
2.7 Inverse Functions
We have seen that when every vertical line crosses a curve
at most once then
the curve is the graph of a function f. We called this procedure the vertical
line test. Now, if every horizontal line crosses the graph at most once then
the function can be used to build a new function, called the inverse function
and is denoted by f-1, such that if f takes an input x to an output y
then f-1 takes y as its input and x as its output. That is
f(x) = y if and only if f-1(y) = x.
When a function has an inverse then we say that the function is invertible.
Remark 1
The test used to identify invertible functions which we
discussed above is
referred to as the horizontal line test. Important family of functions
that
satisfies the horizontal line test is the family of one-to-one functions. Any
function that is either always increasing or always decreasing on its domain
is a one-to-one function.
Example 1
Use a graphing calculator to decide whether or not the function is invertible,
that is, has an inverse function.

Solution .
(a) Using a graphing calculator , the graph of f(x) is given in Figure 2.7.1.
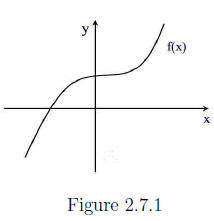
We see that every horizontal line crosses the graph once
so the function is
invertible.
(b) The graph of g(x) = |x| (whose graph is a V-shape)
shows that there are
horizontal lines that cross the graph twice so that g is not invertible.
Remark 2
It is important not to confuse between f-1(x) and (f(x))-1. The later is just the reciprocal of f(x), that is,
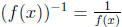
whereas the former is how the inverse function is represented.
Domain and Range of an Inverse Function
Figure 2.7.2 shows the relationship between f and f-1.
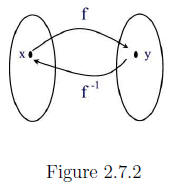
This figure shows that we get the inverse of a function by
simply reversing
the direction of the arrows. That is, the outputs of f are the inputs of f-1
and the outputs of f-1 are the inputs of f. It follows that
Domain of f-1 = Range of f and Range of f-1 = Domain of f.
Example 2
Consider the function
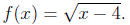
(a) Find the domain and the range of f(x).
(b) Use the horizontal line test to show that f(x) has an inverse.
(c) What are the domain and range of f-1?
Solution .
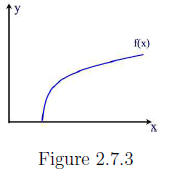
(a) The function f(x) is defined for all x≥4. The range is the interval

(b) Graphing f(x) we see that f(x) satisfies the horizontal line test and so
f has an inverse. See Figure 2.7.3.
(c) The domain of f-1 is the range of f, i.e. the
interval The range
of f-1 is the domain of f, that is, the interval
 .
.
Finding a Formula for the Inverse Function
How do you find the formula for f -1 from the formula of f? The procedure
consists of the following steps .
1. Replace f(x) with y.
2. Interchange the letters x and y.
3. Solve for y in terms of x .
4. Replace y with f-1(x)
Example 3
Find the formula for the inverse function of f(x) = x^3 + 7.
Solution.
As seen in Example 10.1, f(x) is invertible. We find its inverse as follows.
1. Replace f(x) with y to obtain
2. Interchange x and y to obtain

3. Solve for y to obtain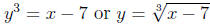
4. Replace y with f-1(x) to obtain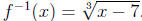
Compositions of f and its Inverse
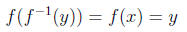
Suppose that f is an invertible function. Then the expressions y = f(x) and
x = f-1(y) are equivalent. So if x is in the domain of f then
and for y in the domain of f-1 we have
It follows that for two functions f and g to be inverses
of each other we must
have f(g(x)) = x for all x in the domain of g and g(f(x)) = x for x in the
domain of f.
Example 4
Check that the pair of functions and
and are
inverses of each other.
are
inverses of each other.
Solution.
The domain and range of both functions consist of the set of all real numbers .
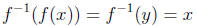
Thus, for any real number x we have
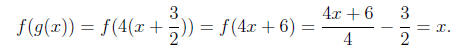
and
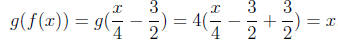
So f and g are inverses of each other.
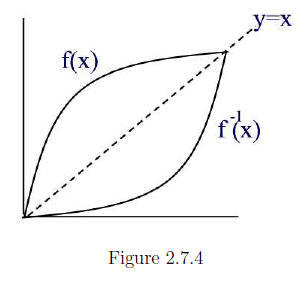
Graphical Relationship between f(x) and f-1(x)
Points of the form (a, b) and (b, a) are at an equal distance from the line
y = x. Since a point (x, f(x)) is on the graph of f(x) and (f(x), x) is on the
graph of f-1(x) we conclude that the graphs of f(x) and f-1(x) are sym-
metric with respect to the line y = x. See Figure 2.7.4.
| Prev | Next |