Investigating Trigonometric Functions
I. Click on the section titled “Sine Inverse Function” (or click the tab at
the
bottom of the screen. Answer the following questions:
1. Click on “Show y = x for reflection”. Why are we interested in examining the
line y = x when dealing with inverses?________________________________
_______________________________________________________________
2. Click on “Show Sine Inverse”. Is the new inverse graph a function ? _______
How did you make
your
decision?____________________________________________________________________
3. Drag point X. Watch points A and B. What do you notice about points A and
B? ______________
________________________________________________________________________________
Using your knowledge of inverses, explain why this is happening?
__________________________
________________________________________________________________________________
4. Click on “Hide Sine Inverse”. Click on “Show Sine Inverse Function”.
5. This new graph is only a “portion” of the previous inverse graph. Why is
the sine inverse function
graph only a “portion” of the sine inverse graph?
________________________________________
_______________________________________________________________________________
6. What is the domain of this restricted graph?
____________________________________________
Over what domain of the original function was this inverse formed?
_________________________
7. What is the range of this restricted graph? ______________________________________________
8. The notation used in Sketchpad for sine inverse is sin−1(x) . What other
notation can also be used
to represent sine inverse?
___________________________________________________________

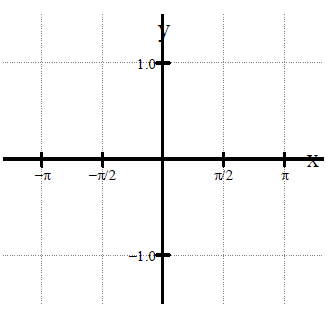
9. Using the grid at the left, graph the sine inverse
function.
Be careful that your x- values in full decimal form
from Sketchpad and the x- values in radian notation
on the graph grid represent the same values.
10. Explain why the domain of this inverse function graph
was chosen as you see it in Sketchpad? ___________
___________________________________________
___________________________________________
___________________________________________
II. Click on the section titled “Cosine Inverse Function”
(or click the tab at the
bottom of the screen. Answer the following questions:
1. Click on “Show y = x for reflection”. What function name is given to the
line y = x ?____________________________________________________
2. Click on “Show Cosine Inverse”. Is the new inverse
graph a function ? _______ What is the name
of the test used to determine if the inverse of a function is itself a
function?____________________
3. Drag point X. Watch points A and B. Are the x and y values switching places? _______________
4. Click on “Hide Cosine Inverse”. Click on “Show Cosine
Inverse Function”. Again, the inverse
function graph is only a “portion” of the full inverse graph
5. What is the domain of this restricted graph?
____________________________________________
Over what domain of the original function was this inverse formed?
_________________________
6. What is the range of this restricted graph? ______________________________________________
7. Explain why the domains of the original functions over
which the sine inverse function and the
cosine inverse functions were formed are
different ._______________________________________
________________________________________________________________________________
8. The notation used in Sketchpad for cosine inverse is
cos−1 (x) . What other notation can also be
used to represent cosine inverse?
_____________________________________________________

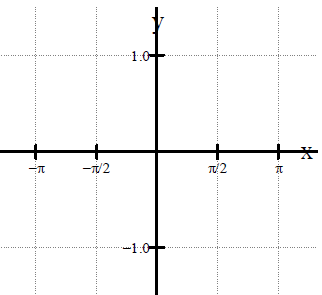
9. Using the grid at the left, graph the cosine inverse
function.
Be careful that your x- values in full decimal form
from Sketchpad and the x- values in radian notation
on the graph grid represent the same values .
III. Click on the section titled “Tangent Inverse
Function” (or click the tab at the
bottom of the screen. Answer the following questions:
1. Click on “Show y = x for reflection”. Click on “Show Tangent Inverse”.

2. Is the new inverse graph a function? _______________
3. Click on “Hide Tangent Inverse”. Click on “Show
Tangent Inverse Function”.
4. What is the domain of this restricted graph? _________
Over what domain of the original function was this
inverse formed? ______________________________
5. What is the range of this restricted graph? __________
____________________________________________
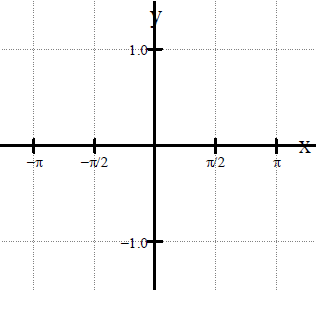
6. Using the grid at the left, graph the tangent inverse
function.
| Prev | Next |