Mathematics Entry Points of Grade 7
| Grade 7 | |||||||
| Learning Standards as written | Essential and Prioritized Skills | ||||||
| Patterns, Relations, and Algebra |
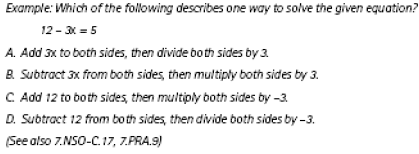
7PRA6 | Write and solve two -step linear equations and
check the answers. |
♦ Solve linear equations and check answers | ||||
| Less Complex | Possible Entry Points | More Complex | |||||
| The student will:
♦ Identify a linear equation
|
The student will:
♦ Check the answer to an equation
|
The student will:
♦ Solve one- step linear equations using manipulatives
and check the answer |
|||||
| General Education Example | |||||||
 |
|||||||
| Grade 7 | |||||||
| Learning Standards as written | Essential and Prioritized Skills | ||||||
| Patterns, Relations, and Algebra |
7PRA7 | Identify, describe, and analyze
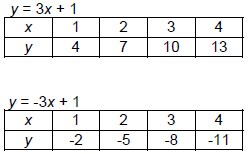
linear relationships between two variables . Compare positive rate of change (e.g., y = 3x + 1) to negative rate of change (e.g., y = – 3x + 1). |
♦ Analyze linear relationships between two variables |
||||
| Less Complex | Possible Entry Points | More Complex | |||||
| The student will:
♦ Identify linear relationships Example: y = 3x + 1
|
The student will:
Using a number line and/or manipulatives describe
|
The student will:
♦ Analyze linear relationships using a
|
|||||
| Grade 7 | |||||||
| Learning Standards as written | Essential and Prioritized Skills | ||||||
| Data Analysis Statistics & Probability |
7DASP1 | Find, describe, and interpret
appropriate measures of central tendency (mean, median, and mode) and spread (range) that represent a set of data. |
♦ Calculate and interpret central tendency | ||||
| Less Complex | Possible Entry Points | More Complex | |||||
| The student will:
♦ Match a set of data to its |
The student will:
♦ Answer questions about a set of data (e.g., did
more |
The student will:
♦ Use a calculator to find the mean of a data |
|||||
| Grade 7 | |||||||
| Learning Standards as written | Essential and Prioritized Skills | ||||||
| Data Analysis, Statistics & Probability |
7DASP2 | Select, create, interpret, and use
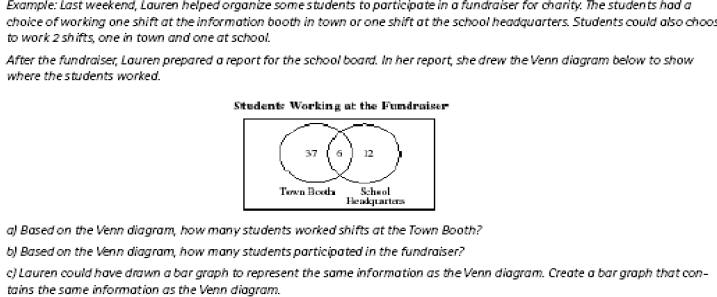
various tabular and graphical representations of data (e.g., circle graphs , Venn diagrams, stem-and-leaf plots, histograms, tables, and charts) |
♦ Select, create, interpret, and use tables, charts or graphs to represent data |
||||
| Less Complex | Possible Entry Points | More Complex | |||||
| The student will:
♦ Match a set of data to its |
The student will:
♦ Classify data based on similarities and |
The student will:
♦ Collect and represent a data sample and make |
|||||
| General Education Example | |||||||
 |
|||||||
| Grade 7 | |||||||
| Learning Standards as written | Essential and Prioritized Skills | ||||||
| Data Analysis, Statistics & Probability |
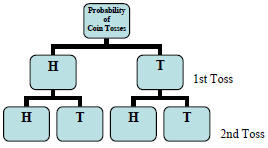
7DASP4 | Use tree diagrams, tables, organized
lists, and area models to compute probabilities for simple compound
events (e.g., multiple coin tosses or rolls of dice). |
♦ Compute probabilities | ||||
| Less Complex | Possible Entry Points | More Complex | |||||
| The student will:
♦ Identify a tree diagram or a data
|
The student will:
♦ Answer questions about the completed
|
The student will:
♦ Determine the probability of an event occurring
Examples: coin toss, roll of a die, spinner, etc. |
|||||
| General Education Example | |||||||
 |
|||||||
| Prev | Next |


