Negative Exponents and Rational Functions
1 Shapes of Power Functions with negative exponents
Like the power functions we looked at last time, the power
functions with negative exponents have graphs with
distinctive shapes and patterns. Specifically, these functions look like

etc., or as fractions, like  , etc.
For all of these functions, we have 1 divided by something , and this can never
be zero.
Power functions with negative exponents will never intercept the x-axis.
While the graphs of these functions will never touch the
x-axis, they will get infinitely close. For large values
of x, both positive and negative, we have 1 divided by a really large number.
The result is a function value
that is very small, that is, very close to zero.
The end behavior of a power function with negative
exponent will have the graph approaching
the x-axis.
For x = 0, we have 1 divided by zero in all of these
functions. Dividing by zero makes no sense, and is
undefined. For values of x very close to zero, however, the function is defined,
and we have 1 divided by a
very small number (either positive or negative), and the result is a very large
function value (either positive
or negative). Therefore, as the graph gets close to x = 0, that is the y-axis,
the function values will go to
±∞.
Around x = 0 for power functions with negative exponents,
the graph will go to ±∞. We
will say that it will approach the y-axis asymptotically.
The graphs of the power functions
 with n = 1, 2, 3 are shown in Figure 1. In
all of these, note
that the graphs approach the x-axis to the left and right, and they approach the
y-axis in the middle.
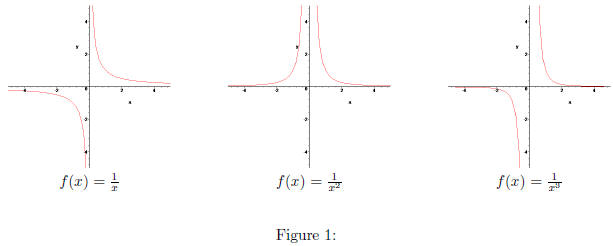
The different powers affect the graph in two major ways. The odd powered
functions are negative when x is
negative.
For power function with negative exponents, the left side
of the graph lies below the x-axis
for odd exponents.
Second, as the exponents get larger, the function values
approach zero faster, and they go to ±∞ faster.
For larger negative exponents, the graph is closer to the x-axis and further
from the y-axis.
1.1 Quiz 07A
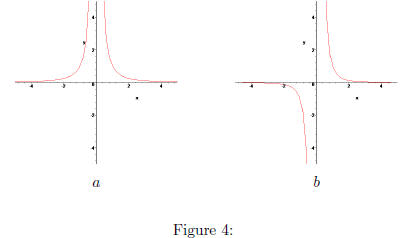
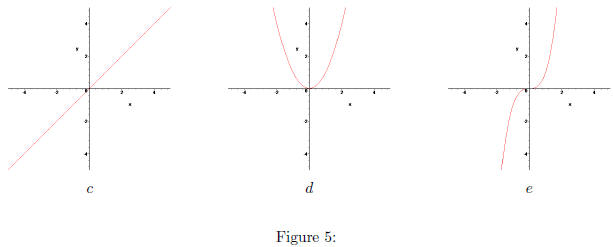
Sketch the graphs of the following functions. In Figures 4
and 5 are some graphs. In Blackboard, enter the
letter of the graph that most resembles your sketch.
QA1.
QA2. 
2 End Behavior of Rational Functions
A rational function is a fraction where the numerator and
denominator are both polynomials . For example,
 (1)
(1)
is a rational function.
Today, we will go over a quick analysis of the end behavior for rational
functions. We’ll do the middle part
next time. As we saw with polynomials, the leading terms dominate behavior for
large values of x (both
positive and negative). This being the case, the leading term of the numerator
will dominate the numerator
of a rational function, and the leading term of the denominator will dominate
the denominator for large
values of x. For example, for the function f given above, x4 and x2 dominate
the end behavior of the graph.
As a result, the end behavior is similar to the function
 (2)
(2)
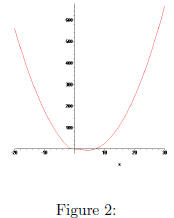
At the ends, at least , the graph of f should look like a
parabola . The graph of f is shown in Figure 2. It’s
wiggly in the middle, but somewhat parabolic on the ends.
Here are few more examples. Consider the function
 (3)
(3)
The function h should act like
 on the ends. (Note that I’m using the symbol
to say “acts like.”) That
means that it should approach the x-axis from above on both ends. The graph is
in Figure 3.
Now consider the function i.
 (4)
(4)
The function i has a higher degree denominator, and it
acts like  That is, it will approach the
x-axis
from below on the left end and from above on the right. It’s graph is shown in
Figure 3.
Next, consider the function j.
 (5)
(5)
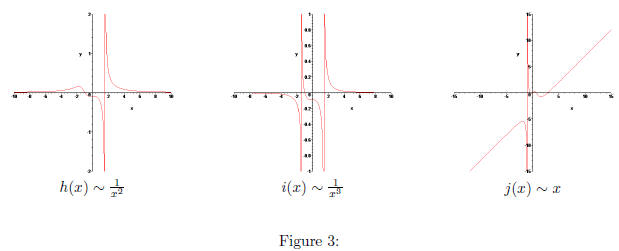
This function acts like x on the ends, so it should look
like a straight 45 line on both ends. This graph is
also shown in Figure 3.
Again, we’ll look at the middle behavior next time. Today, we’re just looking at
the ends.
2.1 Quiz 07B
Sketch the end behavior of the following functions. In Figures 4 and 5 are
some graphs. In Blackboard,
enter the letter of the graph whose end behavior most resembles your sketch.
QB1. 
QB2.
QB3. 
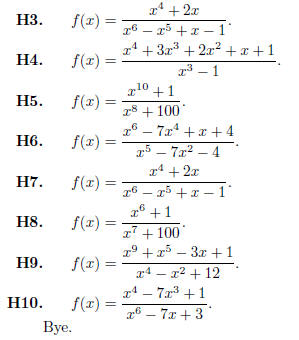
3 Homework 07
For each rational function, determine which graph in
Figures 4 and 5 has the most similar end behavior.
The letter under the graph is what you’ll input into Blackboard.
H1. 
H2. 
 H3. f(x) =
| Prev | Next |