Notes on Graphing Linear Inequalities
1. Solve the inequality for y . Be sure to change the
inequality symbol if you multiply or divide
by a negative number .
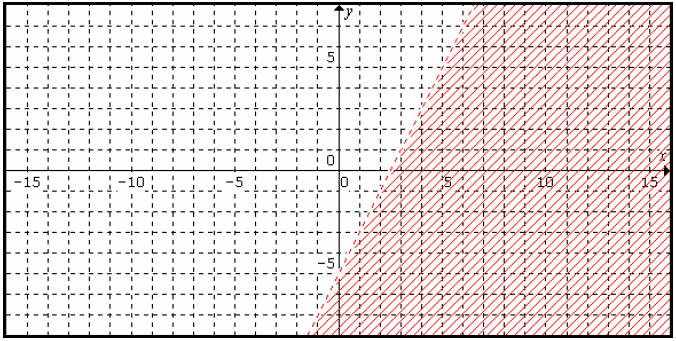
2x – y > 5
-y > -2x + 5
y < 2x - 5
2. Pick out the slope and the y -intercept. m = 2 and b = -5
3. Plot the y - intercept and do the slope to get points on the line.
4. If the inequality includes equal then draw a solid
line. If the inequality does not include an
equal sign then draw a dashed line. This has the same meaning as our open and
closed circles or
in interval notation the parentheses and brackets .
5. Pick a point on one side of the line and substitute it
into the original inequality to see if it
satisfies it. If it does, then shade that side. If it doesn’t, then shade the
other side. Do not pick a
point that is on the line .
y < 2x – 5
Assignment
Read section 9.3 and these notes carefully
1. Do on page 617 #8, 12, 14, 22, 30
2. These graphs are to be done on graph paper
3. Assignment is worth 25 points (15 required and 10 bonus)
| Prev | Next |