Exponential Functions
In this chapter we will study the exponential function and its inverse the logarithmic function . These important functions are indispensable in working with problems that involve population growth, decay of radioactive materials, and other processes that occur in nature.
In an exponential function , the function value is obtained by raising a fixed number, called the base, to a variable power. Recall that in Section 1.3 we defined ax if a > 0 and x is a rational number, but we have not yet defined irrational powers. In more advanced texts it is shown that ax exists for all real number values of x, both rational and irrational. Since this is beyond the scope of our text, we will assume that ax exists for all real numbers x, and that the Laws of Exponents are still true when the exponents are real numbers, without justification.
We begin graphing exponential functions by finding several ordered pairs that belong to the function, plotting these points, and connecting them with a smooth curve .
Example 1: Sketch the graphs of the functions

by making atable of values .
Solution:
Step 1: Choose some values of x and find the
corresponding values of
f (x) and g (x).
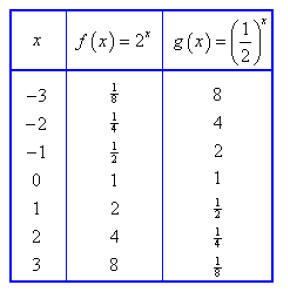
Step 2: Plot the points found in the previous step
for f (x) and g (x), and
draw a smooth curve connecting them.
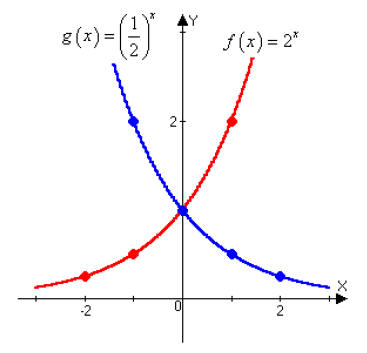
Step 3: Notice that

and so we could have obtained the graph of g from the
graph of
f by reflecting in the y-axis.
The figure below shows the graphs of the family of exponential functions f (x) = ax for various values of the base a. Notice that all of these graphs pass through the point (0, 1).
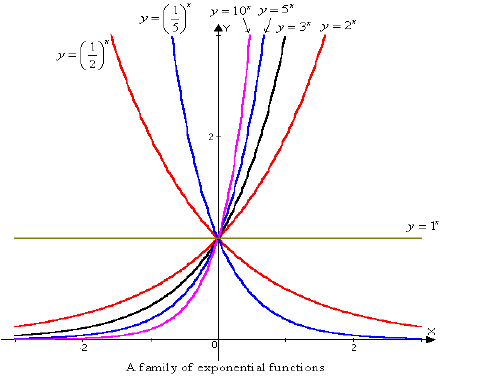
From the figure you can see that there are three kinds of exponential functions y = ax:
•If 0 < a < 1, the exponential function decreases rapidly.
•If a = 1, it is constant.
•If a > 1, the function increases rapidly, and the larger the base, the more
rapid the increase.
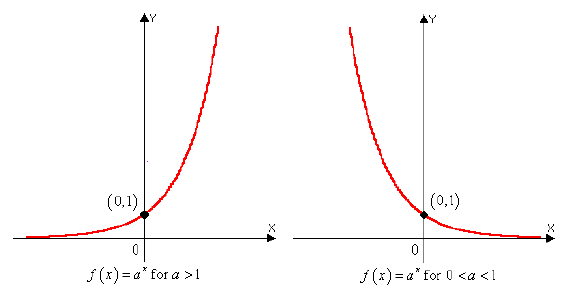
Also, if a > 1, then the graph of y = ax approaches y = 0 as x decreases through negative values, and so the x-axis is a horizontal asymptote. If 0 < a < 1, the graph approaches y = 0 as x increases indefinitely and, again, the x-axis is a horizontal asymptote. In either case the graph never touches the x-axis because ax > 0 for all x. Thus, for a ≠ 1, the exponential function f (x) = ax has domain (-∞, ∞) and range (0, ∞). Let’s summarize the preceding discussion.
Exponential Functions:
For a > 0, the exponential function with base a is defined by

For a ≠ 0, the domain of f is (-∞, ∞), the range of f is
(0, ∞), and the graph of
f has one of the following shapes:
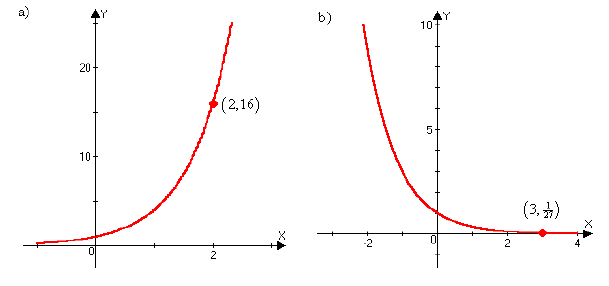
Example 2: Find the exponential function f (x) = ax whose graph is given.
Solution a ):
The function is exponential, so we know the equation will be of the form
f (x) = ax. Looking at the graph, we see it contains the point (2,
16).
Using this point, we can determine the base of the exponential function,
by substituting 2 for x and 16 for f (x).

Thus, the exponential function is f (x) = 4x
Solution b ):
This graph of an exponential function contains the point

Substituting 3 for x and  for f (x) we get

Thus the exponential function for this graph is

In Section 4.5 we learned how to perform transformations on library functions to find the graphs of more complex functions . We can now add the exponential function to our list of library functions. We perform transformations to the exponential function using the same techniques as in Section 4.5.
Example 3: Graph the functions, not by plotting
points, but by starting from the graphs
in the figure found after Example 1 and performing transformations on
them. State the domain, range, and asymptote.

Solution a ):
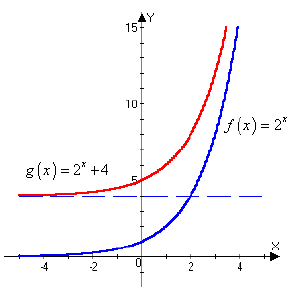
Step 1: To obtain the graph of g(x) = 2x + 4,
we start with the graph of
f (x) = 2x and shift it upward 4 units.
Step 2: Notice that while the horizontal asymptote
is not actually part of
the graph, it also shifts upward 4 units, and so the horizontal
asymptote of g(x) = 2x + 4 is the line y = 4. Looking at the
graph, we see that the domain of g is (-∞, ∞), and the range is
(4, ∞).
Solution b):
Step 1: Based on the translation techniques we studied in Section 4.5, the
graph of f (x) = -5x-2 is the reflection of the graph of f (x) = 5x
in the x-axis, shifted to the right 2 units.
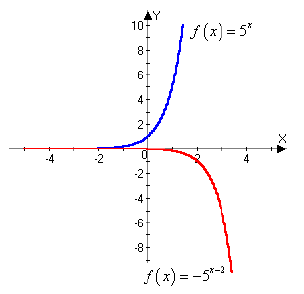
Step 2: Since there was no vertical shift, the horizontal
asymptote of f is
y = 0. Also, the domain is (-∞, ∞) and the range is (-∞, 0).
| Prev | Next |