
Precalculus I Lecture Notes
2.1 Functions
Relation vs. Function
Value of a function
Implicit form of a function
Domain of a function
Find the domain:
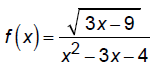
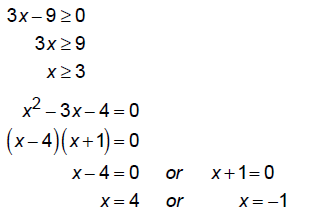
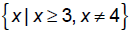
Combing these restrictions we get
Sums, differences , products, and quotients of functions
2.2 Relations
Identify the graph of a function
Obtain information from the graph of a function
2.3 Properties of Functions
Determine even and odd functions from a graph
Even functions are symmetric about the x-axis (like )
)
Odd functions are symmetric about the origin (like

Identify even and odd functions from the equation
For even functions, f(x) = f(-x) for example,

For odd functions, f(x) = -f(-x) for example
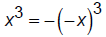
Is 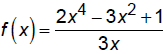 even, odd, or
neither?
even, odd, or
neither?
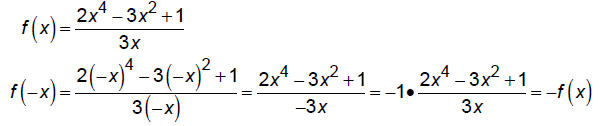
So, the function is odd.
Use a graph to determine where a function is increasing,
decreasing, or constant
Local maxima and local minima
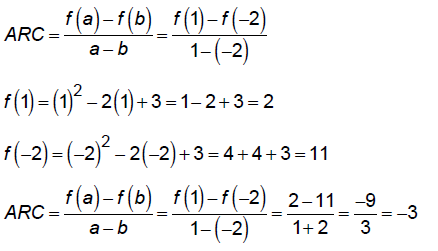
Average rate of change of a function
Find Average Rate of Change of
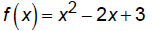 from –2 to 1:
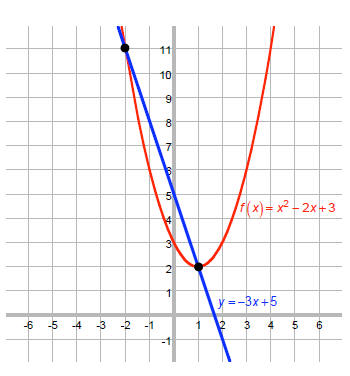
Secant line
Find equation of secant line for
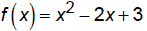
that connects the points 
The slope of the line is m = –3, as we calculated above .
The equation of the line is the line whose slope is –3 and
which passes through the points (–2, 11) and (1, 2).
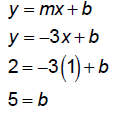
So, the equation is y = -3x + 5
2.4 Library of Functions & Piecewise-defined Functions
Square root , cube root, absolute value, square, cube,
reciprocal, greatest integer
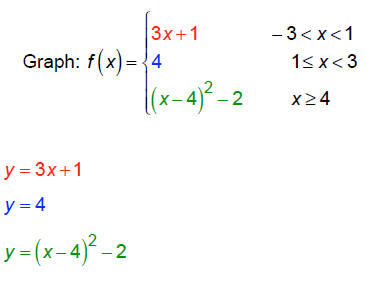
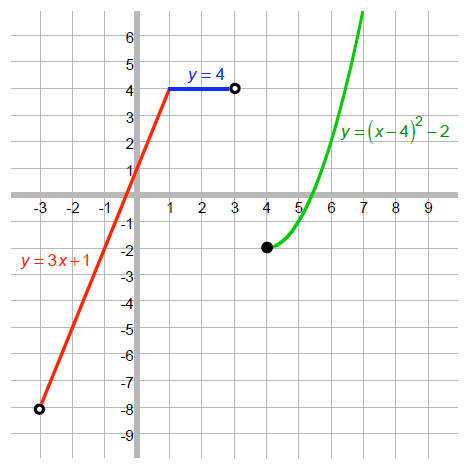
Piecewise-defined functions
2.5 Graphing Techniques & Transformations
Vertical shifts
Horizontal shifts
Compressions
Stretches
Reflections about xaxis
and yaxis
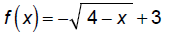
Graph using transformations:
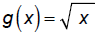
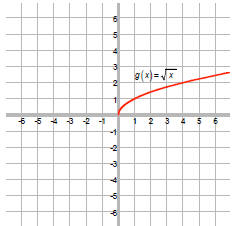
Start with
The negative outside the function ( square root )
reflects the graph about the x-axis:
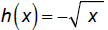
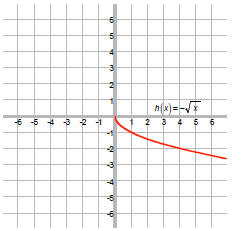
The negative inside the function (square root) reflects
the
graph about the y-axis:
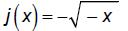
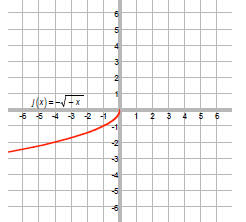
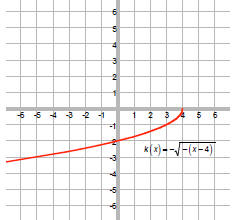
The 4 shifts the graph four units. Since the 4 and x have
opposite signs, the shift is to the right. That is, we can
write this as
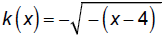
Note that when x = 4, y = 0 so we know it shifts right.
The 3 shifts the graph up 3 units:

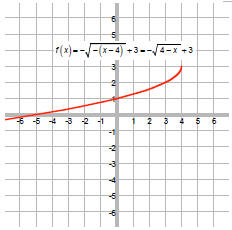
Plot some points
x-intercept:
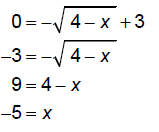
y-intercept:

start of graph:

2.6 Mathematical Models & Building Functions
Applications of building and analyzing functions
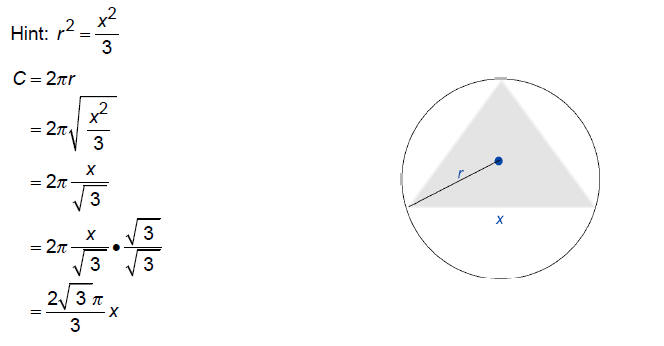
pg 108, #16: An equilateral triangle is inscribed in a
circle of radius r. Express the circumference C of
the circle as a function of the length x of the side of the triangle.
3.1 Linear Functions and Their Properties
Graph linear functions
Average rate of change
Determine whether a linear function is increasing, decreasing, or constant
Applications of linear functions (word probs)
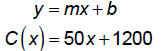
Write an expression for the cost C of producing x bicycles
in a day if C is a linear function of x, each
bicycle costs $50 to produce, and the fixed costs for the factory are $1200 per
day.
The rate or slope is 50 bicycles per day and the y-intercept is $1200 per day.
3.3 Quadratic Functions and Their Properties
Define quadratic function
Graph a quadratic function using transformations
Vertex , axis of symmetry, and intercepts of a quadratic function
The x- coordinate of the vertex is

Maximum or minimum value of a quadratic function
3.4 Quadratic Models & Building Quadratic Functions
Applications of quadratic functions (word probs)
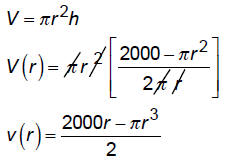
A cylindrical silo is made with a circular top and sides
using 2000 square feet of metal. Express the
volume V of the silo as a function of the radius r.
The volume of a cylinder is
 . So, we have to express the height in terms
of r .
. So, we have to express the height in terms
of r .
The surface area of the silo is:

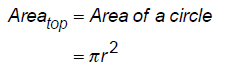
 (if you unwrap the
silo you get a rectangle of height h and width 2πr , the
(if you unwrap the
silo you get a rectangle of height h and width 2πr , the
circumference of the silo).
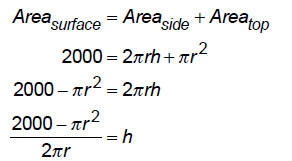
So, we have
3.5 Inequalities Involving Quadratic Functions
Solve inequalities involving a quadratic function
We will do these when we do rational inequalities on Wednesday.
| Prev | Next |