Exploring Mathematics with the Inequality Graphing Application
Exploring Mathematics with the Inequality Graphing Application
Introduction
A day at an amusement park is full of excitement. Roller
coasters flip, dip, and twirl
you around. Remember when roller coaster thrills were off limits to you because
you
were not yet tall enough to meet the height requirement? Amusement parks
require that a person must be at least 48 inches tall in order to ride roller
coasters.
You can represent “at least” or “at most” situations with
mathematical inequalities.
In this exploration, you will write an inequality using two variables . You will
also
graph two- variable inequalities in a Cartesian coordinate plane .
Problem
During a basketball game, teams receive one point for free
throws scored, two
points for field goals, and three points for long-range field goals. In last
weekend’s
game, the Shooting Stars scored a total of 60 points from field goals, both
regular
and long-range.
How many of each type of field goal did the Shooting Stars
possibly make? Write a
linear equation that represents this situation.
_____________________________________________________________________________
How would your equation change if the Shooting Stars had
scored more or less than
60 points?
_____________________________________________________________________________
_____________________________________________________________________________
Exploration
1. Let x represent the number of 2-point field goals
scored by the Shooting Stars
and y represent the number of 3-point field goals scored by the Shooting Stars.
Write an equation that represents the total points scored from field goals in
last
weekend’s game: ___________________________________
2. Rewrite this equation in slope-intercept form (y = mx +
b): ____________________
What is the slope? __________ What is the y-intercept? __________
3. Clear all equations in the Y= editor of the graphing
handheld. Press  or
or
 to
to
highlight the equation, and then press  Also,
be sure that all plots are
turned off. Because x and y refer to the number of baskets scored, you will use
integer values for both .
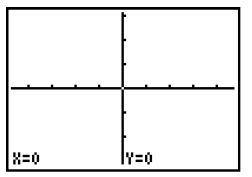
4. Set a viewing window with integer values by
pressing  8 to select 8:ZInteger. Check
that x = 0 and y = 0. (This indicates that the
viewing window will be centered at the
origin.) Press 
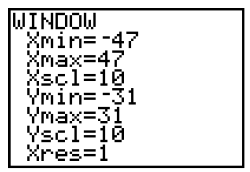
5. Press  and enter the
values shown.
Do these maximum and minimum x and y
values show an appropriate viewing window
for the basketball problem? Explain your
thinking.
__________________________________________
__________________________________________
6. Enter the slope-intercept form of your
equation in the Y= editor of your graphing
handheld. To do so, press  At Y= enter
your equation. Press  Sketch the graph
that you see on your screen.
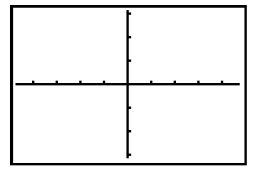
7. You can use the TRACE feature on the graphing handheld
to complete a table
of values that represent possible solutions. Press
 to access the
FORMAT Menu. Select CoordOn. Press 
The coordinates x = 0 and y = 20 should appear on the
screen of your graphing
handheld. What do these values represent with respect to the basketball
problem?
x = ________________________ y = ________________________
These values have been recorded in the table shown.
Next, you will find other values to complete the table.

8. Press  to trace to x
= 1. What is the corresponding y-coordinate? _________
Does this ordered pair represent a solution to the problem ? Why or why not?
________________________________________________________________________
________________________________________________________________________
If it does, add this ordered pair to the table of values.
Continue tracing the integer values for x, from x = 2
through x = 30. Record all
the ordered pairs that are possible solutions to the basketball problem in the
table of values above.
The set of all x-coordinates in a function is the domain.
The set of y-coordinates
in a function is the range. Use your completed table of values to list the
domain
and the range of the function that represent the basketball problem.
Domain: ______________________________
Range: ______________________________
From the table, you can see that as the y-values decrease
by 2, the x-values
___________________.
Would you describe the relationship between the x-values
and the y-values as a
constant or variable? What type of function exhibits this characteristic?
________________________________________________________________________
________________________________________________________________________
________________________________________________________________________
Describe this relationship in terms of the number of
3-point field goals and
the number of 2-point field goals.
________________________________________________________________________
________________________________________________________________________
9. In step 2 you determined that the y-intercept for this
linear relationship is
(0, 20). What is the significance of this point?
________________________________________________________________________
________________________________________________________________________
________________________________________________________________________
10. Press  to trace to
x = 36. What is the corresponding y-value? _____________
Verify algebraically that these coordinate points satisfy the equation from
step 1 by substituting the x - and y-values into the equation.
The ordered pair (36, -4) satisfies the equation in step
1. Can it be a solution to
the basketball problem? Explain why or why not.
________________________________________________________________________
________________________________________________________________________
________________________________________________________________________
________________________________________________________________________
Identify three ordered pairs that satisfy the equation but
are not solutions to
the problem.
________________________________________________________________________
________________________________________________________________________
________________________________________________________________________
11. In their next game, the Shooting Stars want to score
at least 60 points from field
goals. Rewrite the equation from step 1 as an inequality to show this situation.
________________________________________________________________________
Write this inequality in slope-intercept form:
________________________________________________________________________
12. Use the Inequality Graphing App to graph
your inequality. Press  Select Inequalz.
Press  and then press any key to
continue. The equation you entered in step 2
is displayed. At the bottom of the screen, you
should see the equal sign and four inequality
signs.
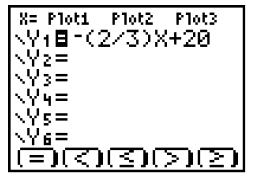
13. Highlight = next to your equation. Press
 to replace the = with the “greater
than or equal to” symbol (≥).
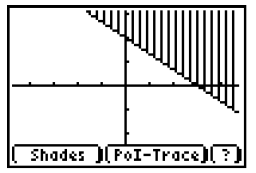
14. Press  (The Shades
and PoI-Trace
buttons appear. You will learn about these
features in later activities.)
Describe the graph. How does it show that
the Shooting Stars scored at least 60 points
from field goals?
__________________________________________
__________________________________________
15. Use the cursor keys to navigate about the
viewing window. (Press  to deactivate
the TRACE feature, if necessary.)
Select a point from the shaded portion of the
graph and record the coordinates:
__________________________________________
Verify algebraically that the point satisfies
the inequality from step 11 by substituting
the x- and y-values into the inequality.
16. Change the inequality in the Y= editor to
2x + 3y > 60. (Be sure to change the
inequality to the slope-intercept form.)
Sketch the graph on the grid. How does the
graph change?
17. Change the inequality to 2x + 3y < 60. Sketch
the graph in the grid. How does the graph
change?
18. Verify your graphs using the Inequality
Graphing App. Enter each inequality in the
Y= editor and press 
How closely do your sketches match the
graphs from the Inequality Graphing App?
| Prev | Next |