Graphing Linear Inequalities
AIM: SWBAT graph a system of linear
inequalities on the coordinate plane
DO NOW:
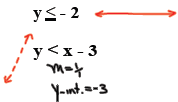
Find the slope & y-intercept:


HW:
P. 434#8, 9, 10,12
Assessment Packet DUE MONDAY!!!
EXAM MONDAY!!!
10.8 GRAPHING LINEAR INEQUALITIES
Example:

You will graph these just like lines :
- Put it in STANDARD FORM 
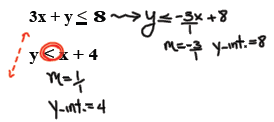
- Find the SLOPE and Y -INT.
- Use the y-int. as 1st point and move to the next
- points using the slope
What’s different about them ?
| - If inequality has < , > } |  |
| - If inequality has < , > } |  |
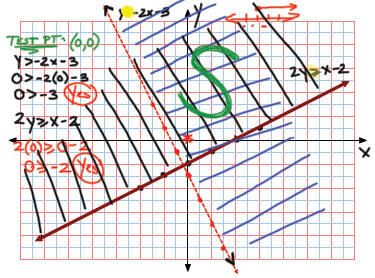
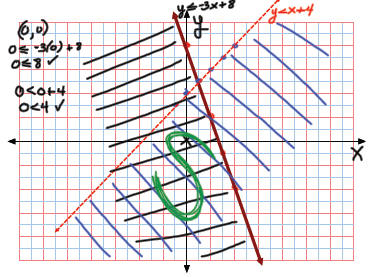
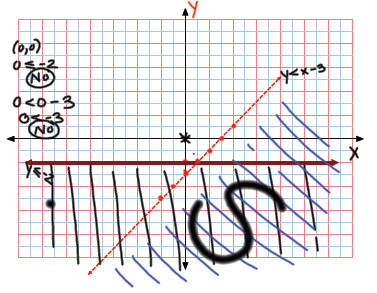
- SHADING (just like regular inequalities:
A) Pick a TEST POINT on either side of
the line (0,0) is the best when available
B) Plug it into the inequality to determine if
it is a solution or not
 If yes, you shade IN
THE DIRECTION
OF THE TEST POINT
 If no, you shade IN
THE OPPOSITE
DIRECTION OF THE TEST POINT
The solution , labeled as “S” is where the 2 shadings
overlap!!
Ex:
Ex:
| Prev | Next |