Exponentials and Logarithms
Understanding the Log Function. In the mathematical
operation of addition
two numbers join to produce a third: 1 + 1 = 2
The operation may be repeated:
1 + 1 + 1 = 3
1 + 1 + 1 + 1 = 4.
Multiplication is the mathematical operation that extends this: 4 × 1 = 4
As for addition, we can repeat multiplication:
2 × 2 × 2 = 8
2 × 2 × 2 × 2 = 16
Just as multiplication is sophisticated addition, exponentiation is the
extension of multiplication :
2 × 2 × 2 = 23 = 8
2 × 2 × 2 × 2 = 24 = 16
This is read ``two raised to the third power equals
eight'' or “two to the
fourth equals sixteen”. Because exponentiation simply counts the number of
multiplications, the exponents add:
23 x 24= 2(3+4) = 27
In the previous examples, `2' is called the base of the exponentiation. Next
if a number with an exponent is raised to another exponent, the exponents
multiply:
(23) 4 = 23 × 23 × 23 × 23
= 2(3+3+3+3) = 212
Also, by definition, any number raised to the zero power is 1, so y0
= 1 for all y.
Numbers can be raised to non-integer powers and negative powers as well.
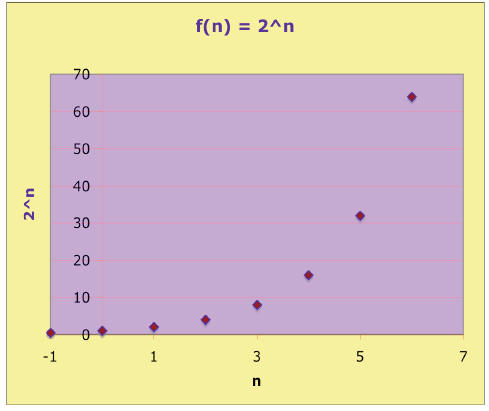
Consider the exponential function y = 2n . The integer values of y
are easy to
find for base 2 :
| n | y = 2n | n | y = 2n |
| -1 | ½ | 3 | 8 |
| 0 | 1 | 4 | 16 |
| 1 | 2 | 5 | 32 |
| 2 | 4 | 6 | 64 |
This integer power relation is also easily plotted:
If we connect the points, the curve shows 2x
for all the values of x, not just
the integers.
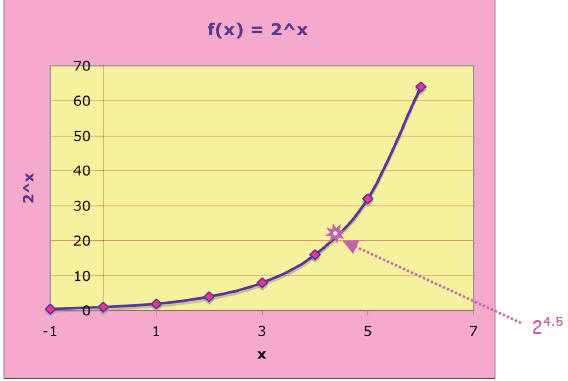
In other words, this relation is a smooth and
continuous function of x, called the
exponential function (base 2) : f(x) = 2x . For example, we can find
24.5 –for, since
4 < 4 .5 < 5, we expect 24 < 24.5 < 25 or 16 <
24.5 < 32. And in fact, 24.5 = _______,
Logarithmic Function. Now let’s go in
reverse—suppose that you have a
number and would like to know how many 2's must be multiplied together to
obtain that number. For example, how many 2's must be multiplied together
to get 512 ? That is, we desire to solve this equation: 2x = 512.
It turns out that 2 × 2 × 2 × 2 × 2 × 2 × 2 × 2 × 2 = 512, so
29 = 512,
which reveals that x = 9 is the solution. For those very situations where
the
finding the power of the exponential is the objective, a new function called
the logarithm enables us to do so. For instance, solving
 is
is
equivalent to solving 29 = 512.
The equation is read as: “the logarithm to the base 2 of 512 is 9”. If you
will, for a given base, the logarithm “filters” a number and picks out the
power to which the base must be raised to reproduce that number. The
logarithm is the inverse function for exponentiation, in other words for a
given base y and exponent a:

that is, y raised to the log base y of a recovers the exponent a again, and
l recovers a.
For concreteness, the base 2 logarithmic function, is shown next:
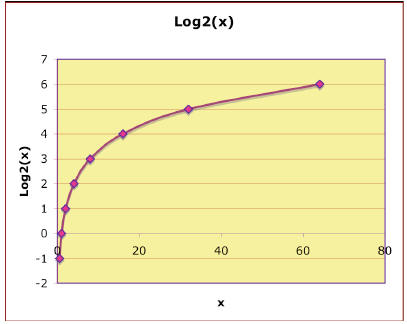
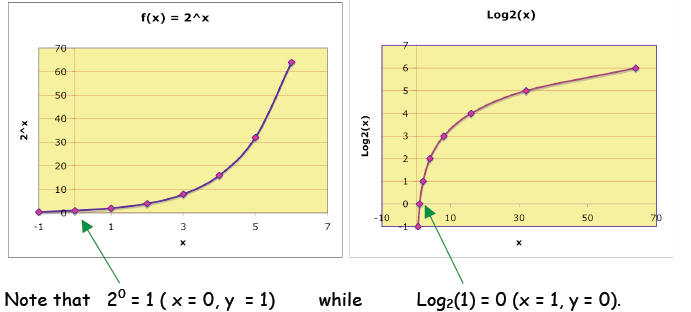
You could imagine that the above graph was created by
switching the x and y
axes of the 2x graph, which is the same as reflecting the exponential
curve
across a 450 line of symmetry1:
Adding Exponents . Earlier, we found that 23
x 24= 2(3+4)
= 27 or in general,
2a × 2b = 2(a+b) . To find the logarithmic
analog of this relation, we take the
log (base 2) of both sides :
 Now, in general, the log base 2 of 2 raised
to a
power is just inverse functions acting in succession on the exponent—they
must cancel each other out—and so we must recover the power again. Thus,
on the right side, we have simply:
l Similarly,
 and
and 
The two sides would agree if  which is
indeed the case. What I have just done here does not constitute a proof
but is, instead, a “hand-waving” argument for congruity.
Now let x = 2a so that
 and similarly let y = 2b—equivalently,
 The law of addition becomes:

This relation is true for any base z, not just base 2, so in general:

Multiplying Exponents. In general, 
Raise both sides to the exponent p: ap = __________
Now, we can combine the exponents by multiplying,:
ap = =
Finally, take the log base z of both sides and “collapse” the right side:
However, due to the properties of inverse functions
Thus we have the relation: 
I remember it as the fact that you can bring an exponent outside of the log
argument and it becomes a multiplying factor:

Finally, a handy relation for converting between bases, stated without proof, is
 Notice that base z can
be any number, it’s as if it “ divides out ”.
Also note that the argument in the denominator becomes the “new base”.
Why the need for this conversion? For example, in analyzing the energies of
electron
transfer in redox equations, physical chemists are fond of the natural log, base
e—“e”
~ 2.718, etc—whereas biochemists prefer base 10 (because the pH is based on that
scale). Thus, a useful specific conversion in that arena is to convert from base
10 to
base “e” (and vice versa) becomes: 
or 
Notice that
1. log base e of x,  , is defined as the
natural logarithm of x,

2. log without a subscript, log(x), is understood to be log base 10,
 .
.
We will have more to say about the natural logarithm, a very important logarithm
in the
next section. For now, let’s test our logarithm-prowess:
Exercise 1. For all x and y for which its logarithm does not vanish or is
undefined,
prove that the product 
From the relation above,  and presumably,
switching
A more elegant way is—noting that base y was mentioned first—to evaluate

Exercise 2. Given  ,without a
calculator, determine:

Answers:
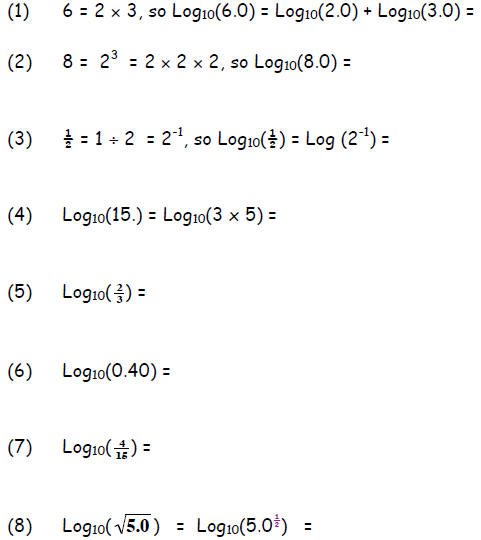

Before sophisticated computers, tricks like these were how
log tables were generated. If you
check these results on your calculator, you will see that these identities work.
Exercise 3 Prove that
1st Order Rate Equation and its
Integrated Form—Consider the process that
describes a species A transforming into something else:
A ---> products.
A first order rate means that decrease in the concentration of A with
time is proportional to
the concentration of the starting material that remains—in this case, the amount
of species A
remaining. The relation can be written as:-d[A] / dt = k[A]
Rearrangement yields the followin d[A] / [A] = - k dt
Now the calculus yields a solution by integration:
where as the right side gives -k(t – 0) = -kt.
We now can write the integrated form for first-order
kinetics, as follows:
 or, reversing the sign and inverting the
argument of Ln:

With the relation of the inverse function of Ln = e, the
last equation can be expressed
alternatively as:
 or
or

Time constant. Whereas chemists analyze kinetics
with respect to rate constants k,
physicists are more fond of of the parameter time constant τ. The relation
between
the two is simple—one is just the inverse of the other,

An example of a phenomena that is naturally and aptly characterized by the time
constant that emerges is the charging or discharging of a capacitor in an RC 5
circuit.
Note that when the switch is closed we have a complete circuit, whereas when the
switch
is open, the capacitor is disconnected from the voltage source (EMF ) It turns
out that
the time for charge to build up after the switch is closed, or to dissipate
after the
switch is opened is equal to a few time constants.
Switch Closed/ Complete Circuit Switch Opened/Open Circuit

Charging an RC circuit :
Let E be the voltage rating of the EMF source, VB be the voltage drop
across the resistor
R and Vc be the voltage drop across the capacitor C. According to the 1st
Kirchhoff Law,
the source voltage added to the voltage drops around the circuit


Now by Ohm’s law, the voltage across time

where I is the current in ampere (A) and R is the resistance in ohm (Ω) . For a
capacitor,
the voltage across a capacitor is given by  where
Q is the charge on the capacitor
in Coulomb (C), and C is its capacitance in Farad (F). I apologize for the
alphabet soup.
Since we want you to think like physicists, we need to know the relationships
among these
units and think their implications through before we proceed:
A Volt ≡ Joule/Coulomb, so a voltage is an energy per charge. On the other hand,
a Farad
≡ Coulomb/Volt so a Farad is a charge per volt. In other words, if we apply a
certain
voltage across a capacitor, depending on the shape and size of the capacitor,
that
capacitor can only store so much charge Q without breaking down and
short-circuiting7.
The capacitance measures the capacity of the capacitor to store charge.

During a thunderstorm, clouds become highly charge with
static
electricity, amassing a huge voltage difference. The charges really
want to move from the cloud to “ lower potential ” but air serves as a
dielectric, preventing flow. Eventually the cloud becomes so ladened
with charge that the air medium cannot prevent charges from
moving in the air between the clouds. The path that these
energetic charges make causes the lightning that we see.
Thus, the 1st Kirchhoff Law becomes: E - RI - Q/C = 0
Now, written in this way, we do not gather much insight as to how the charge Q
on
the capacitor and the current I in the rest of the circuit depends upon time,
or,
specifically, upon the sizes of the capacitor and the resistor. However we note
that
current I arises from the mobility of charge Q or, in general, its change with
time.
That is, the quantity current is a rate—the change in
charge with time, 
Making this key substitution in the Kirchhoff equation yields
 or
or

which is now unambiguously a linear
non-homogeneous first order equation
in the variable Q with constant
coefficients. After some quick
finagling, its solution leads to the
voltage across the capacitor having the
time dependence shown at left.
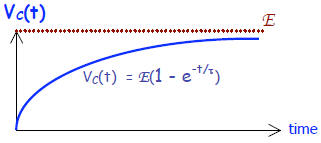
Solution  and also
where exp = e = 2.718 is the base of the natural logarithm and τ , the time
constant, is
given by: 
 so
so

But, as an ampere is ,
substitution into
 yields
 (in unit second)
The time constant τ = RC reveals how quickly the capacitor “charges” or
discharges. When
the lapsed time equals
The voltage builds up across the capacitor, while concurrently the current damps
out
across the resistor.
Discharging a capacitor: now the EMF is cut off (switch opened). If the
capacitor had
been charged for some time before the switch is opened, it is the sole source of
any
voltage. Thus, the Kirchhoff “loop” rule now reads: or VR must equal VC.
Now one has a homogeneous linear 1st order equation with constant
coefficients that
immediately leads to a damped exponential as solution:


Example 1. An RC-circuit has R = 4.0 mΩ and
capacitance equal 5.0 μC.
(a) Determine the time constant of the circuit in ns (nanosecond, 10-9
s).
(b) If the capacitor was fully charged before the emf was disconnected,
how long (ns) does it the capacitor take to decay to 10% of its fully charged
voltage?
Solution
(a) 
(b) Let E be the fully charged voltage. Then 
Divide out E and take the natural log of both sides:
or 
Example 2. The keypad of your computer is actually connected to a tiny
capacitor.
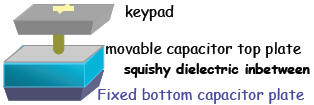
When you press down on the keypad, the top capacitor plate
moves closer. (There
is a squishy material called a dielectric between the plates). The effect of
pressing
down on the keypad is to switch on the circuit. Releasing the keypad switches
off
the circuit. For clarity, the rest of the circuitry is not shown. Suppose that
you
type 60 words a minute or about 800 symbols per minute. Ignoring the inertial
“bounce” of the keypad,
(a) What must be the maximum time response (ms) of the key pad in order
to distinguish different signals ? (2 sig figs)
(b) Now divide this by 3 and you have a ball park of the RC time constant
that the keypad’s effective circuit must produce.
(c) Suppose that the resistance is 0.50 kΩ. What must be the capacitance
in μF ? (2 sig figs).
Solution
(a) As there are 800 signals per minute to be transmitted to the computer,
each signal takes
This gives us a ball park estimate of the time interval needed.
(b) To meet above criterion, a safe time constant should be
(c) Now we ask that  or
or
Example 3. Sketch on a graph  the
voltage across the resistor of an RC
circuit during charging. [Hint: Use the 1st Kirchhoff Law and the
expression for  to determine the function of
 ].
].
Solution. The 1st Kirchhoff Law (the only one we know so far) gives:

from which we deduce  Next, the voltage
across a charging
capacitor goes as
Thus, which infers the
plot:
Voltage across resistor R while a capacitor is CHARGING:

Concurrently, the capacitor is charging up:

Apparently, there is maximum voltage across the resistor
when there is no
charge on the capacitor. But as the capacitor builds charge a back voltage is
developed that abates the flow of charge in the circuit until it stops it
altogether. For instance, after 3 time constants, you’re down to less than 5%
of the current, while the voltage across the capacitor has attained 95% of
full voltage, Vc= 0.95E.
Next, we turn to other examples of the use of exponentials and logarithms.
We return to a more physical chemistry one, but also employed describing
radio-isotopic decay, the use of half lives:
Half life of a 1st order reaction: The half life of a reaction
τ1/2 is the time that it
takes to consume half of the starting material. For a first order reaction,

Now set [A] = ½ [A0] and t = τ1/2
and solve for
 so that
 or
or 
One significant observation of the half life of a 1st
order reaction is that the
expression makes no reference whatsoever to initial concentration of starting
material: The half life of a first order process is independent of initial
concentration, depending essentially inversely upon the rate constant. This
is one
of the appeals of assuming a 1st order rate law in geological and
cosmological
dating, because, for instance, we do not know the initial concentrations of
materials at the start of the universe.
Carbon-14 and Carbon-14 Dating—A working example of 1st order
kinetics is
displayed in carbon -14 dating: Carbon-14 is a radioactive isotope formed in the
atmosphere by nitrogen-14 bombarded by cosmic rays. The amount of carbon-14
in the atmosphere is relatively constant.
Plants take in carbon-14 through the process of photosynthesis. Animals eat the
plants so they also have carbon-14 in their tissues. Carbon-14 is decaying
constantly with a half-life of 5720 years. As long as the organism is alive, an
equilibrium concentration of C-14 is established and the amount of carbon-14
remains relatively constant.
However, when the organism dies, the amount of C-14 will decrease over time, as
there is no further uptake. By comparing the activity of an archeological
artifact to
that of a sample of the living organism, one can estimate the age of the
artifact.
Example: An artifact is claimed to hail from the Victorian era
(1837-1901). A
curator contracts an analytical chemist who will check this claim by carbon
dating.
This is accomplished by comparing concentrations of the isotope carbon-14. The
rate constant of this isotope is k = 1.212 × 10⁻⁴ y-1 and
the process of decay is
assumed 1st order. The concentration of C-14 in the artifact is determined to be
98.4% of that of a freshly cut sample of the same type of wood used to make the
artifact. Suppose that the error in the determination is ±15 years. Does the art
indeed hail from the Victorian era ?
Solution: C-14 activity in the tree was 100% peak before the wood was cut
to
make the artifact. So, as I tell my students, larger concentration in numerator,
and you’re good to go:
 imply
imply so
that
Time interval Now, it
being 2006, we
subtract 133 from 2006 = 1873. Even if we add or subtract the error of ±15 y,
the
result falls well within the Victorian era 1837-1901, for
1873 – 15 = 1858 and 1873 + 15 = 1898.
So in this case, if the brushstrokes, types of oils and canvas, style, and age
of the
proposed artist using that particular style is judged to be compatible, there is
a
strong possibility that the claims are true.
Madame Curie and her unit: A curie, named after Madam Marie Curie, is the
amount of radioactivity in one gram of radium, the element that she and her
husband Pierre discovered. One gram of radium experiences
3.7 × 10¹⁰ dps (37
billion disintegrations per second). If the activity of a certain amount of an
isotope is determined, you can figure out the number of atoms in a gram of its
element by referring to the periodic table. Then, assuming that the decay rate
obeys 1st order kinetics, you can determine the half life of the
isotope.
Example. A 1.80 milligram sample of Thorium 234 has an activity of 41.6
Curie
(a) If the mass of a nucleon is about 1.6605 x 10⁻²⁴ g, determine how
many
thorium nuclei are present (initially). (b) Determine the half life of Thorium
234
in seconds (c) Convert the answer in (b) to unit day.
Solution. (a) Drawing upon general chemistry, we can obtain the number of
isotopes initially present in a couple ways:
(i) the number of atoms of an element in a mass of the element is found by
dividing by the molar mass (unit g/moL) of the element, then multiplying by
Avogadro’s number, 6.022 x 10²³ items per mole:
# Thorium nuclei =
×
= ____________
(ii) There are 234 nucleons in a Thorium-234 nucleus, each of these average mass
1.6605 x 10⁻²⁴ g. Thus the number of thorium nuclei in the 1.80 mg
sample must be:
1.80 mg ×
= _____________
(b) Since radioactive decay is assumed to be 1st
order, we use Rate = kN, where N is
the number of isotopes initially. The rate is given in curie as
41.6 Curie = k(______________ nuclei)
Thus, dividing by N , the rate constant k = R/N
k = 41.6 Curie × ×
where we can interpret dps as nuclei per second, and so obtain k = ___________
( unit?) Then the half life is
 = _______________ (unit?)
(c) Converting to per day : _________
 _______
Entropy and the Natural Logarithm: A Whirl-wind Survey
It is difficult for me to survey the usage of logarithms and exponentials in the
physical
sciences without subjecting you to their beautiful application in statistical
physics,
which is my field of pursuit. In fact, it is impossible.
Thermal physics and statistical mechanics deal with the use of statistical
methods to
understand the behavior of complex, many-particle systems; in particular, this
machinery was originally developed to understand quantitatively the ideas of
temperature, heat flow, efficiency, and irreversibility. Among the new concepts
appear
in thermal physics that are not present in mechanics are the important
indicators
entropy and temperature.
Why is a statistical approach needed? Most problems involving more than two
particles
seldom have exact solutions. Nevertheless, the air in our classroom (on the
order of
1024 particles) seems to be in a well-defined "equilibrium state".
This air can be
characterizing by a small number of parameters (temperature, density, volume,
etc.).
Though it is impossible to monitor the movements of each individual particle,
amazingly,
predictions can made concerning the average behavior of the whole set of
particles.
We also know that
• heat flows from hot objects to cold objects spontaneously, and never the
reverse,
• without additional energy input, gas rushes spontaneously into a previously
evacuated compartment,
• diversity in nature favors mixed configurations and tends to avoid pure ones
What is the driving force? Statistical and thermal physics aim to examine
characteristics
like these of very large systems. The machinery of statistical physics is
extremely
powerful because of its generality. The same formalism used to understand the
classical
ideal gas can be applied to understanding such highly quantum mechanical
problems as
 electrons in
metals, electrons in
metals, |
 information
theory, information
theory, |
 black body
radiation, black body
radiation, |
 power grids, power grids, |
 Bose-Einstein
condensation, Bose-Einstein
condensation, |
 (financial)
market behavior, (financial)
market behavior, |
 the behavior
of ferromagnets the behavior
of ferromagnets |
 sports
predictions sports
predictions |
The probability of finding a system in a given state depends upon the multiplicity of
that state, i. e., to the number of ways you can produce that state. Here a "state" is
defined by some measurable property which would allow you to distinguish it from
another configuration.
Example: In throwing a pair of dice, the measurable property is the sum of the
number of dots facing up. The multiplicity for snake eyes (two dots showing) is just
one, because there is only one arrangement of the dice which will give that state. The
multiplicity for seven dots showing is six, because there are six arrangements
(possibilities) of the die which display a total of seven dots.
.
Definitions: A particular die configuration corresponds to a microstate. Microstates
with the same sum are grouped into a macrostate.
Plotted below are the frequency or number of ways of obtaining a particular sum. This
“number of ways” is precisely the multiplicity function, Ω(n) for the simple two die
system; ‘n’ is a value between 2 and 12. Obviously, the total number of microstates =
11. Notice that the multiplicity function peaks for n = 7. [Ω(7) = 6 is read “the number
of ways to attain 7 (as sum of two die) equals 6.”] This mid value, 7, is most likely to
be tossed.
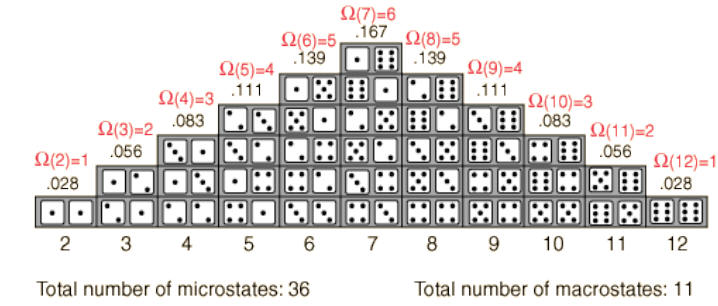
One can say that the multiplicity function counts the
number of microstates within a macrostate
designation.
Consider some well defined system consisting of N particles possessing total
energy E
confined to a volume V. For a given energy, there will be a certain number of
states
accessible to the system —call this number the multiplicity, Ω— (i. e., those
states “live”
at that energy). If we can count all the states accessible to the system at
that
energy, we may determine the entropy of the system. In fact, the entropy has
a
remarkably simple form, ascribed to Ludwig Boltzmann—related to the natural
logarithm
of the multiplicity— 
where kB is Boltzmann's constant. The SI unit of entropy is
Joule/Kelvin, which is also
the unit of kB. The multiplicity for ordinary collections of matter are on the
order of
Avogadro's number, so employing the natural log of the multiplicity makes
quantitative
analysis tractable.
Multiplicity arises in a plethora of physical systems, and its significance is
contextual and
varies according as certain interactions are included or ignored. For a system
of a large
number of particles, like a mole of atoms, the most probable state will be
overwhelmingly
probable. You can confidently expect that the system at equilibrium will be
found in the
state of highest multiplicity since fluctuations from that state will usually be
too small to
measure.
As a large systesystem approaches equilibrium, its multiplicity (entropy) tends
to increase. This
is the elegant statistical way of stating the second law of thermodynamics.
A more systematic way to count the possible states is gleamed from the field of
combinatorics.
Entropy and Possibilities, Counting Possibilities: the Binary Model
For simplicity, we will restrict ourselves to systems that obey a binary model.
The short
definition: Two possible outcomes.
Toss 3 pennies “fair” coins : outcome heads or tails? Only
23 = 8 possible incomes
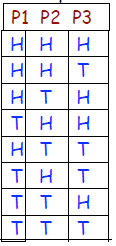
Macrostate any configuration with 2 tails, TTH, THT HTT
Microstate the particular configuration TTH
Multiplicity Ω(3,2) = 3
In general the multiplicity of a macrostate
describing the probability of flipping N coins
producing n heads :

 read as “ N choose n”
Notice that this curious term is just a binomial
coefficient.
The probability of getting n outcomes out of N independent events/coins for a
binary
choice would go as where, of course, the
probability is
normalized: The probability that any n < N occurred must add to 1 :

Example Suppose you flip 20 un-weighted coins. Find
(a) the number of all the possible outcomes (microstates) and macrostates
(b) the probability of getting the exact sequence
HTHHTTTHTHHHTHHHHTHT
Hint: (divide Ω(N, n) by 220 events)
(c) the probability of getting 12 H and 8 T in any order.
Answer
(a) 220 = _______________microstates as opposed to _________
macro-states
(b)
(c) Ω(20, 8) =
Possibility vs. Probability: Huge Systems
A graph of the binomial distribution for N = 15 is shown
below, as well as a curve that
approximates it. For only 15 outcomes, the distribution looks pretty discrete.
But what
happens to Ω(N,n) as N gets bigger: the curve smoothes out, the peak value,
which
always occurs at n = ½N, gets very large and the width of the distribution grows
steadily
narrower - i.e. values of n/N far away from the peak get less and less likely as
N
increases. The width is in fact the standard deviation of a hypothetical random
sample of
n, and is proportional to  The fractional
width (expressed as a fraction of the total
range of n, namely N) is therefore proportional to


For example, for really large N, say N = 1024,
the binomial distribution will have fractional
width ~ one part in 1012.
When two systems interact with each other and are allowed to exchange energy, a
very similar phenomena occurs as discussed for the one large system. Now the
joint
system evolves so as to maximize the joint possibilities. The distribution curve
now
peaks when both systems—assumed identical—each possess half the energy and falls
off EXTREMELY rapidly with increasing disparity (“lop-sided”; one possessing
more
energy than the other). In 3 dimensions, the distribution looks like:
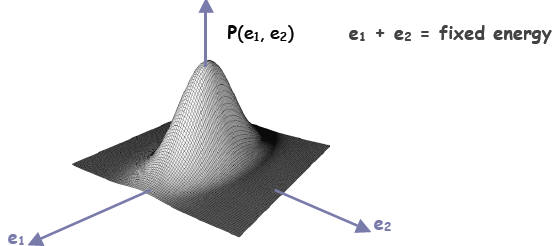
The distribution above suitably describes a system for
which there are
independent outcomes in the x and y direction, or the outcome is the product of
the independent outcomes of two systems.
It can be shown when the two systems reach equilibrium, and a little energy is
transferred from 1 to 2, the loss in possibilities from subsystem 1 is just
compensated by the gain in possibilities in subsystem 2. When the change in
possibilities per energy change is the same in both systems, the joint system is
at
thermal equilibrium and the rate described defines the temperature of the
joint
system.
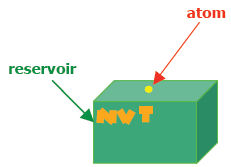
Finally, suppose that thermal equilibrium has been established between a very
large
system of volume V and maintained at temperature T—and a much smaller one, such
as an atom. A typical available thermal energy to “borrow” from the larger
system—the reservoir—is kBT, where kB is the same
Boltzmann’s constant in the
entropy definition. The probability that the atom may “borrow” energy E from the
reservoir goes as
Probability of possessing energy E
at temperature 
The quantity is called
the Boltzmann factor and plays a pivotal unequivocal
role in the energy analysis of huge systems.
APPENDICES—both are British sources, so expect
British spellings
I. Medicinal Radioisotopes: A radioisotope used for diagnosis must emit
gamma rays of
sufficient energy to escape from the body and it must have a half-life short
enough for it
to decay away soon after imaging is completed.
The radioisotope most widely used in medicine is technetium-99m, employed
in some 80%
of all nuclear medicine procedures - 40,000 every day. It is an isotope of the
artificiallyproduced
element technetium and it has almost ideal characteristics for a nuclear
medicine scan. These are:
• It has a half-life of six hours which is long enough to examine metabolic
processes
yet short enough to minimise the radiation dose to the patient.
• Technetium-99m decays by a process called "isomeric"; which emits gamma rays
and low energy electrons. Since there is no high energy beta emission the
radiation
dose to the patient is low.
• The low energy gamma rays it emits easily escape the human body and are
accurately detected by a gamma camera. Once again the radiation dose to the
patient is minimised.
• The chemistry of technetium is so versatile it can form tracers by being
incorporated into a range of biologically-active substances to ensure that it
concentrates in the tissue or organ of interest.
Its logistics also favour its use. Technetium generators, a lead pot enclosing a
glass tube
containing the radioisotope, are supplied to hospitals from the nuclear reactor
where the
isotopes are made. They contain molybdenum-99, with a half-life of 66 hours,
which
progressively decays to technetium-99. The Tc-99 is washed out of the lead pot
by saline
solution when it is required. After two weeks or less the generator is returned
for
recharging.
A similar generator system is used to produce rubidium-82 for PET imaging from
strontium-82 - which has a half-life of 25 days. On the other hand, Myocardial
Perfusion
Imaging (MPI) uses thallium-201 chloride or technetium-99m and is important for
detection and prognosis of coronary artery disease.
For PET imaging, the main radiopharmaceutical is Fluoro-deoxy glucose (FDG)
incorporating F-18 - with a half-life of just under two hours, as a tracer. The
FDG is
readily incorporated into the cell without being broken down, and is a good
indicator of
cell metabolism.
In diagnostic medicine, there is a strong trend to using
more cyclotron-produced isotopes
such as F-18 as PET and CT/PET become more widely available. However, the
procedure
needs to be undertaken within two hours of a cyclotron.
II. Verification of the Siloam Tunnel mentioned in the Bible
CBS News ^ | Updated 10 Sep 2003 | CBC News Online staff
JERUSALEM – (2003, CBC news) Scientists have found and radio-dated a tunnel
described in the Bible. The books of Kings II and Chronicles II report the
construction
of the Siloam Tunnel during the reign of King Hezekiah, who ruled 2,700 years
ago.

Jerusalem
It was built to move water from the
Gihon spring into ancient Jerusalem
protecting the city's water supply in the
event of an Assyrian siege.
It has been difficult for scientists to
verify modern equivalents of buildings
mentioned in the Bible because specimens
have been poorly preserved, hard to
identify and access.
Amos Frumkin of the geography department at the Hebrew University of Jerusalem
and
colleagues at the Israel Geological Society and Reading University in England
radio-dated
the tunnel's lining to around 700 BC. They report their findings in [the then
recent] issue
of the journal Nature. The tunnel is now a half-kilometre-long passage running
up to 30
metres below Jerusalem's ancient city walls.
Frumkin says the tunnel is the first biblical structure dating from the Iron Age
to be
authenticated. The researchers conclude the Bible presents an accurate
historical record
of the tunnel's construction.
The Siloam Tunnel was built without using an intermediate shaft, considered an
engineering feat for its time. The tunnel had an inscription commemorating its
completion
but it doesn't say who dug it. Frumkin's team dated plant material in the
plaster lining of
the tunnel and stalactites that grew from the ceiling shortly after it was
built. They used
radio-isotope dating to determine the age of the samples. Radioactive elements
decay
over time, acting as a physical clock. Scientists measure the proportions of
radioactive
elements to estimate age
| Prev | Next |