Functions
2.1 What is a Function?
A function is a relationship between two sets with the restriction that for
every element in the first set (the
x’s) there is only one value in the second set (the y’s.)
Example 1: The circle x2 + y2 = 25 is not a function since choosing x = 4 gives
two values of y, y = 3 and
y = -3.
Example 2: The line 3x + 2y = 6 is a function since picking a value for x
results in only a single value for
y. For instance, picking x = 4 gives one answer, y = -3.
Functions can also be represented by tables of values or by graphs.
Values of Functions
The value of a function is found by replacing the variable by the indicated
value.
Example 3: For the function 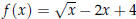 , find f (9) and f(a2)
.
, find f (9) and f(a2)
.
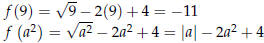
Solution :
Domain
The domain of a function is the set of values that can be used for the
independent variable, x. Typically,
the domain is found by first determining the values that are not in the domain.
Example 4: Find the domain of  .
.
Solution:
Since square roots can only be used on non- negative values , x - 3 ≥0. Therefore,
the domain is
x ≥3 or x ∈ [3,∞).
Example 5: Find the domain of  .
.
Solution:
Since the denominator of a fraction cannot be zero, x + 2 ≠ 0. Therefore, the
domain is x ≠ -2
or x ∈ (-∞,-2)  [ (-2,∞).
Range
The range of a function is the set of values that can be used for the dependent
variable, y. To find the range
of a function, the easiest ways are to examine the function for ”obvious”
features or to look at the graph of
the function .
Example 6: Find the range of the function
![]() .
.
Solution:
The square root function always produces a non-negative result. Therefore the
range of
![]() is the set of y ∈ [0,∞).
is the set of y ∈ [0,∞).
Example 7: Find the range of the function
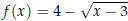 .
.
Solution:
Since the square root function always produces a non-negative result,
produces a value of 4 - something, such as 4, 3, 2, . . . . Therefore, the range
is the set of
y ∈(-∞, 4].
2.2 Graphs of Functions
Piecewise Continuous Functions
Piecewise continuous functions are constructed from two or more separate parts,
as in the following.
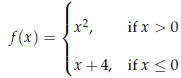
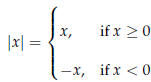
Absolute Value
The absolute value function f (x) = lxl is really a piecewise continuous
function.
The Greatest Integer Function
The greatest integer function is defined as
[[x]] = greatest integer less than or equal to x
Example 8: Find [[5]], [[2.8]] and [[-2.3]].
Solution:
The greatest integer function always round down to the nearest integer so we
have [[5]] = 5,
[[2.8]] = 2, and [[-2.3]] = -3.
Another name for [[x]] is the floor function or
 . The floor function can be
found on many calculators .
. The floor function can be
found on many calculators .
Families of Functions
A family of functions is a set of functions that has a specific feature that
changes. For example, the family
given by f (x) = x2 + c is the set of parabolas that open upward and have a
vertex on the y-axis.
2.3 Rate of Change
The average rate of change of a function is simply the slope of the line segment
connecting two points on
the function.
A function is said to be increasing if the average rate of change is positive
and decreasing if the average
rate of change is negative.
A function can be both increasing and decreasing. For example, y = x2 is
decreasing on x ∈ (-∞, 0) and
increasing on x ∈ (0,∞).
2.4 Transformations of Functions
A transformation of a function means to change one or more characteristics of a
function while keeping
the same basic function behavior. Typically, transformations are considered
geometrically. Starting with a
function y = f (x),
• Vertical shift: y = f (x) + k moves the graph of f vertically by k units.
• Horizontal shift: y = f (x - h) moves the graph of f horizontally by h units.
• Flip vertically: y = -f (x) flips the graph of f upside-down.
• Stretch(shrink) vertically: y = c f (x) changes the height of the graph of f
by a factor of c .
• Stretch(shrink) horizontally: y = f (cx) changes the width of the graph of f
by a factor of  .
.
Even and Odd Functions
A function y = f (x) is said to be even if f (-x) = f (x). A function y = f (x)
is said to be odd if
f (-x) = -f (x). Even functions are symmetric to the y axis and odd functions
are symmetric to the origin.
2.5 Quadratic Functions
A quadratic function has the form f (x) = ax2 + bx + c and has a parabola as its
graph. Using the method
of completing the square, it can be converted to standard form
f (x) = a(x - h)2 + k, where (h, k) is the vertex of the parabola.
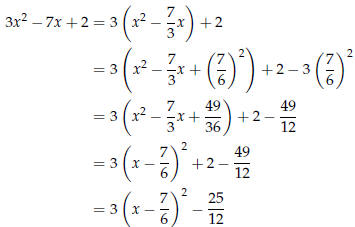
Example 9: Write the function f (x) = 3x2 - 7x + 2 in the form f (x) = a(x - h)2
+ k.
Solution:
Using the method of completing the square from Chapter 1,
Extrema of a Quadratic
An extrema is a maximum or minimum point on a graph. The vertex of the quadratic
f (x) = a(x - h)2 + k
is a minimum point if a > 0 and a maximum point if a < 0. A shortcut for finding
the x- coordinate of the
vertex is to use the vertex formula

Example 10: Find the vertex of f (x) = -0.02x2 + 7.1x +
14.3 and determine if the vertex is a maximum or
a minimum.
Solution:
Since the coefficient of x 2 is negative, we know that the parabola opens
downward and
therefore, the vertex is a maximum point. The x-coordinate of the vertex is
Substituting back into the function, the y value is
f (177.5) = -0.02(177.5)2 + 7.1(177.5) + 14.3 = 644.425
Therefore, the vertex of the parabola is at (177.5, 644.425) and the vertex is a
maximum point.
Extrema of Other Functions
To find the extrema of others functions, the simplest method is to look at the
graph of the function.
However, this can be misleading.
Example 11: Use a calculator to locate the extrema of
f (x) = 0.1x5 + 0.53x4 - 0.438x3 - 4.832x2 - 0.376x + 11.904. You can assume
that all the extrema are in
the interval -5≤ x ≤5.
Solution:
Start by sketching the graph in the window -5 ≤x ≤5, -10 ≤y ≤15. As seen in Figure
2.1,
there is something happening near x = -3 but it is not obvious that there is an
extreme point.
Figure 2.1: Graph of f (x) using -5 ≤ x ≤ 5, -10 ≤ y ≤15
As seen in Figure 2.2, zooming in on the point eventually shows both a maximum
and a
minimum point but it takes some effort.

Figure 2.2: Graph of f (x) using -3.3 ≤ x≤ -2.7, -0.002 ≤ y ≤ 0.002
| Prev | Next |