Quadratic Function Models
Consider the following table of the number of Americans
that are over 100 in
various years.
| Year | Number (in 1000’s) |
| 1994 1996 1998 2000 2002 2004 |
50 56 65 75 94 110 |
How many would you predict would be over 100 in 208?
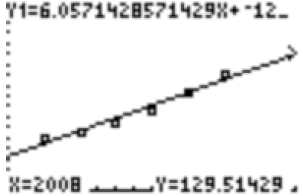
Let’s plot the data in our calculator , using L1 for Year and L2 for Number.
Set a WINDOW of [1992, 2008] × [0, 180].

The data is more curved than linear , but not so much that
linear regression is
not an option. The line of best fit for linear regression is
y = 6.057x − 12.033.229
or
f(x) = 6.057x − 12.033.229.
| Prev | Next |