Using Data
Using Data; Addition and Subtraction of Fractions
The authors of Everyday Mathematics believe that students
should do serious and
substantial work with data. Unit 6 provides many activities designed to present
and
teach relevant data skills and concepts, allowing your child ample opportunities
to practice organizing and analyzing the data he or she collects.
The data that your child initially collects will usually consist of an
unorganized
collection of numbers. After organizing the data using a variety of methods , he
or
she will study the landmarks of the data. The following terms are called
landmarks
because they show the important features of the data:
 The maximum is the largest data value
observed.
 The minimum is the smallest data value
observed.
 The range is the difference between
the maximum and the
minimum.
 The mode is the “most popular” data
value—the value observed
most often.
 The median is the middle data value
observed.
 The mean, commonly known as the
“average,” is a central value
for a set of data.
At the end of the unit, students will have an opportunity to
demonstrate their skills in this area by conducting a survey of their
peers; gathering and organizing the data; analyzing their results; and
writing a summary report .
Your child will continue his or her work with the American Tour by
studying a variety of Native American measurements for length and
distance based on parts of the body. Students will convert these
body measures to personal measures by measuring their fingers,
hands, and arms in both metric and U.S. customary units. In
addition, your child will learn how to read a variety of contour-type
maps, such as climate, precipitation, and growing-seasons maps.
Finally, students will explore addition and subtraction of fractions by
using paper slide rules, the familiar clock face, and fraction sticks.
They will learn to find common denominators and apply this skill in
adding and subtracting fractions with unlike denominators.
Please keep this Family Letter for reference as your
child
works through Unit 6.
Vocabulary
Important terms in Unit 6:
| angle of separation A measure of how far fingers can be spread apart. The figure shows the angle of separation between a person’s thumb and first finger. |
 Angle of separation |
common denominator Any number except zero
that is a multiple of the denominators of two or more
fractions. For example, the fractions 1/2 and 2/3 have
common denominators 6, 12, 18, and so on.
contour line A curve on a map through places where a
certain measurement (such as temperature or elevation) is
the same. Often, contour lines separate regions that have
been colored differently to show a range of conditions.
cubit An ancient unit of length, measured from the
point of the elbow to the end of the middle finger.
A cubit is about 18 inches.
decennial Occurring or being done every 10 years.
fair game A game in which each player has the same
chance of winning. If any player has an advantage or
disadvantage (for example, by playing first), then the
game is not fair.
fathom A unit used by people who work with boats
and ships to measure depths under water and lengths
of cables. A fathom is now defined as 6 feet.
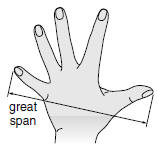
| great span The distance from the tip of the thumb to the tip of the little finger (pinkie), when the hand is stretched as far as possible |
 |
landmark A notable feature of a data set. Landmarks
include the median, mode, maximum, minimum, and
range.
line plot A sketch of data in which check marks, Xs,
or other marks above a number line show the
frequency of each value.
map legend (map key) A diagram that explains the
symbols, markings, and colors on a map.
maximum The largest amount; the greatest number in
a set of data.
mean The sum of a set of numbers divided by the
number of numbers in the set. The mean is often
referred to simply as the average.
median The middle value in a set of data when the
data are listed in order from smallest to largest. If there
is an even number of data points, the median is the
mean of the two middle values.
minimum The smallest amount; the smallest number
in a set of data.
mode The value or values that occur most often in a
set of data.
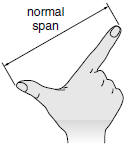
| normal span The distance from the tip of the thumb to the tip of the first (index) finger of an outstretched hand. Also called span. |
 |
population In data collection, the collection of
people or objects that is the focus of the study.
range The difference between the maximum and
minimum in a set of data.
sample A part of a group chosen to represent the
whole group .
simplest form A fraction less than 1 is in simplest
form if there is no number other than 1 that divides its
numerator and denominator evenly. A mixed number is
in simplest form if its fractional part is in simplest form.
| stem-and-leaf plot A display of data in which digits with larger place values are “stems” and digits with smaller place values are “leaves.” |
 image id 5MhU05.L13.0003.T |
survey A study that collects data.
Do-Anytime Activities
To work with your child on the concepts taught in this unit and in previous
units,
try these interesting and rewarding activities:
 Have your child design and conduct an
informal survey. Help him or her collect
and organize the data, and then describe the data using data landmarks.
Challenge your child to create different ways in which the organized data can
be presented.
 Encourage your child to develop his or her
own set of personal measures for
both metric and U.S. customary units.
| Building Skills through Games In this unit, your child will work on his or her understanding of angles and the addition and subtraction of fractions by playing the following games. For detailed instructions, see the Student Reference Book. Frac-Tac-Toe See Student Reference Book, pages 274–276 This is a game for two players. Game materials include 4 each of the number cards 0–10, pennies or counters of two colors, a calculator , and a gameboard. The gameboard is a 5-by-5 number grid that resembles a bingo card. Several versions of the gameboard are shown in the Student Reference Book. Frac-Tac-Toe helps students practice converting fractions to decimals and percents . Angle Tangle See Student Reference Book, page 258 This is a game for two players and requires a protactor, a straightedge, and paper. The game provides practice with measuring angles and estimating angle measures. |
As You Help Your Child with Homework
As your child brings assignments home, you may want to go over the instructions
together, clarifying
them as necessary. The answers listed below will guide you through this unit’s
Study Links.
Study Link 6.1
3.
a. 59 b. 24 c. 33
d. 36 e. 39.5
Study Link 6.2
1. a.–c. Answers vary.
2.
| a. cm; ft | b. ounces; gal; liters |
| c. m; miles | d. cm; ft; mm |
| e. kg; lb; grams |
Study Link 6.3
1. 73
2. 19
3. 53
4. Sample answer: Cross off the highest and lowest
values—31 and 73. Continue by crossing off the
highest and lowest values remaining. Finally, only
the number 53 remains. So 53 is the median.
Study Link 6.4
1. tapes and CDs
2. books and magazines
3. movie tickets
Study Link 6.5
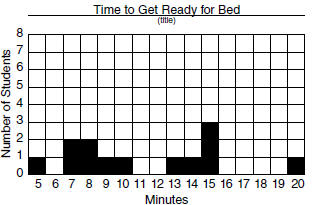
Sample answers given for Problems 1–3.
1. 5, 7, 7, 8, 8, 9, 10, 13, 14, 15, 15, 15, 20
2.

3. The number of minutes it takes to get ready
for bed
Study Link 6.6
1. Sample answer: The ages of the oldest people we
know
Title: The Oldest People Our Class Knows
Unit: Years
2. a. 77 b. 94 c. 85 d. 85
3. Sample answer: Scores on a science test
Title: Science Test Scores
Unit: % Correct
4. a. 32 b. 99 c. 66 d. 78.5
Study Link 6.7
1. Florida; Arizona
2. Oregon; Washington
3. Answers vary.
4. Utah; Wyoming
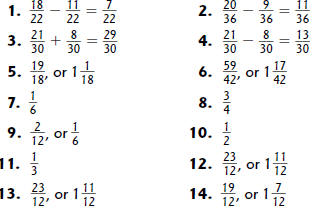
Study Link 6.8

Study Link 6.9

Study Link 6.10

| Prev | Next |