Graphing Quadratic Functions
Warm-up
1. Evaluate the expression  for b =- 3 and a
= 2.
for b =- 3 and a
= 2.
2. Find the value of  in the equation when b
= 4 and a = -2.
in the equation when b
= 4 and a = -2.
3. Find the value of y in the equation  when x = 0.
4. Find the value of y in the equation  when
when
 .
.
5. Find the approximate value of y to two decimal places in the equation
 when x =1.5.
Answers to warm-up
1. –3
2. x = 1
3. y = 5
4. y = -3/4
5. y≈ 3.47
Today we will:
1. Understand how the coefficients of a quadratic function influence its graph
a. The direction it opens
b. Its vertex
c. Its line of symmetry
d. Its y-intercepts
Tomorrow we will:
1. Explore translations of parabolas
.
Parabolas
The path of a jump shot as the ball travels toward the basket is a parabola.

Key terms
 Parabola – a curve that can be modeled with a
quadratic function .
Parabola – a curve that can be modeled with a
quadratic function .
Quadratic function – a function that can be written in the form
y = ax2 + bx + c, where a ≠ 0.
Standard form of a quadratic function – the form y = ax2 + bx + c, where a ≠
0.
Vertex – the point where a parabola crosses its line of symmetry.
Maximum – the vertex of a parabola that opens downward. The y- coordinate of
the
vertex is the maximum value of the function.
Minimum – the vertex of a parabola that opens upward. The y- coordinate of the
vertex is the minimum value of the function.
y-intercept – the y-coordinate of the point where a graph crosses the y-axis.
x-intercept – the x-coordinate of the point where a graph crosses the x-axis.
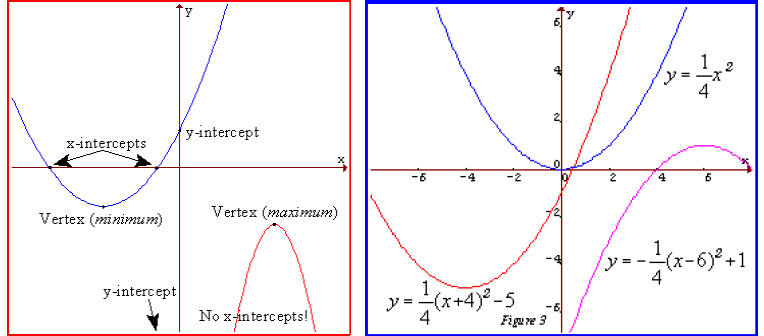
The graph of the quadratic function y = ax2 + bx + c,
where a ≠ 0, is a parabola.
If a is positive
the graph opens up
the vertex is a minimum
If a is negative
the graph opens down
the vertex is a maximum
The line of symmetry is the vertical line
![]() . The x-coordinate of the vertex is
. The x-coordinate of the vertex is
 .
.
To find the y-coordinate of the vertex, substitute
 for x in the function and solve for y .
The y- intercept of the graph of a quadratic function is c.
|
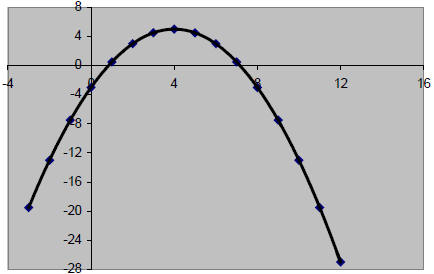
Example 1 Choose the function that models the parabola at the right. A. y = −0.5x2 + 4x + 5 B. y = 0.5x2 + 4x − 3 C. y = −0.5x2 + 4x − 3 D. y = −0.4x2 + 4x − 3 E. y = x2 + 4x + 5 Solution The graph opens down so a is negative. B and E are out. The y-intercept is –3. A is out. Find the line of symmetry.  Choice C:  Choice D:  The line of symmetry is x = 4. C is the correct function. Example 2 Use the function y = 2x2 + 3x −1 A. Tell whether the graph opens up or down. B. Tell whether the vertex is a maximum or a minimum. C. Find an equation for the line of symmetry. D. Find the coordinates of the vertex. Solution A. a is positive, so the graph opens up. B. The vertex is a minimum. 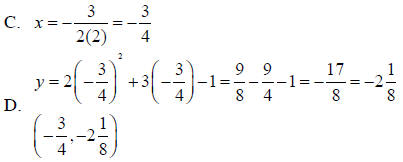 |
Parabola
|
Example 3
Use the quadratic function y = 3x2 −18x + 25
A. Without graphing, will the graph open up or down?
B. Is the vertex a minimum or a maximum?
C. What is the equation of the line of symmetry?
D. Find the coordinates of the vertex of the graph.
E. Find the y-intercept.
F. Graph the function.
Solution
A. a is positive, so the graph will open up.
B. The vertex is a minimum
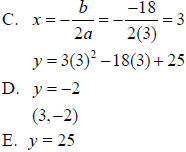
F.
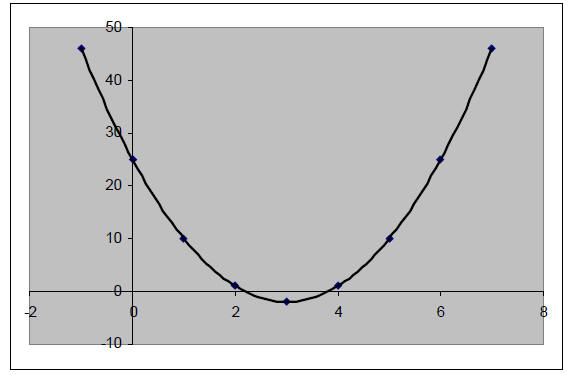
Example 4
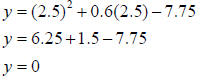
Use the function y = x2 + 0.6x − 7.75
A. Find the y-intercept of the graph.
B. Use a graph to estimate the x-intercepts. Check one x- intercept by
substitution .
Solution
A. The y-intercept is c or –7.75
B. The x-intercepts are 2.5 and –3.1
Check: Substitute 2.5 for x in the original equation.
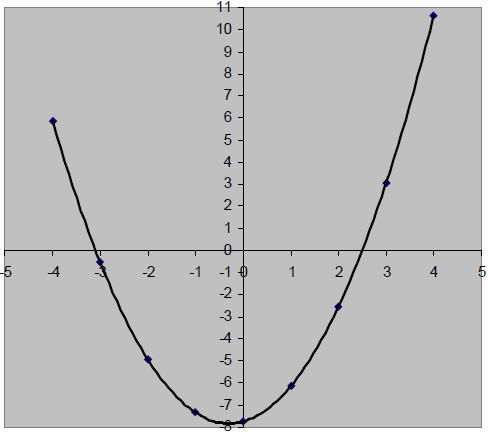
Example 5
Match each equation with its graph.
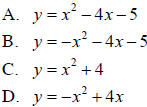
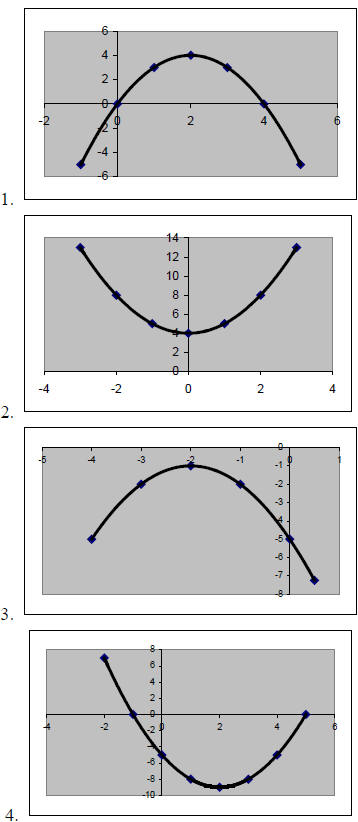
Solution:
A. 4
B. 3
C. 2
D. 1
| Prev | Next |