Compositions and Inverses of Functions
Follow-Up Activity
1. You can see a greater distance from a higher building. A function that
describes the
distance one can see from a tall building on a clear day is D(h) = where
where
h = height in feet and D =distance you can see in miles.
a) The Eiffel Tower is 986 feet tall. How far would you
expect to see on a clear day?
b) The Empire State Building is 1250 feet tall. How far would you expect to see
on a
clear day?
c) The Petronas Towers in Malyasia are 1483 feet tall. How far would you expect
to see
on a clear day?
d) Pollution cuts visibility. Assume that visibility cuts the distance that can
be seen to
35% of the distance seen on a clear day. Write a function that describes
distance on a
cloudy day (C) when given the distance that can be seen on a clear day (D).
e) Determine the number miles that can be seen from the three skyscrapers listed
in parts
a, b, and c.
f) Write a function that describes the distance that can be seen on a cloudy day
as a
function of the height of the building. Explain the composition of functions.
1. From the Eiffel Tower, one can see 38.5 miles. From the Empire State
Building, one
can see 43.1 miles, and from the Petronas Towers in Malyasia, one can see 47
miles.
2. The function for cloudy distance is C(D) = 0.35D .
3. If the day is cloudy the distances change to 13 miles for the Eiffel Tower,
15 miles for
Empire State Building, and 16.5 miles for the Petronas Towers.
4. For the cloudy distance based on the height of the building, the function is
C(D(h)) =  which is a composition.
2
| speed of car (mph) | 0 | 22 | 33 | 44 | 55 |
| braking distance (ft) | 0 | 19 | 43 | 79 | 128 |
a) Develop a mathematical model that allows us to predict
braking distance given the
speed of the car. (This data is extracted from a graph found on page 288 of the
Glencoe Algebra 2
textbook .)
b) Usually when there is a wreck police investigators are attempting to
determine the
speed of the driver. To do this, the investigators measure the length of the
skid marks
left on the pavement. This means the ordered pairs will be (braking distance,
speed).
How could we use the model from part a to create another function that will
allow
you to predict the speed of the driver given the length of the skid marks?
[Hint: Simplify the model found in part a to include only the quadratic term
assuming the other two terms ( linear and constant ) are so small that they do not
affect
the final outcome.]
Look at the data for braking distance as a function of speed by graphing L1, L2.
This is clearly
quadratic and can be fit with quadratic regression to produce l = 0.046s2 −
0.199s + 0.264 .
If we take our equation l = 0.046s2 − 0.199s + 0.264 and drop the constant and
linear terms and
simplify the coefficient of the quadratic term , we would have the model: l =
0.04s2 . If we solve
for s, we get the equation s = 
Student Handout
Compositions and Inverses of Functions
Algebra 2
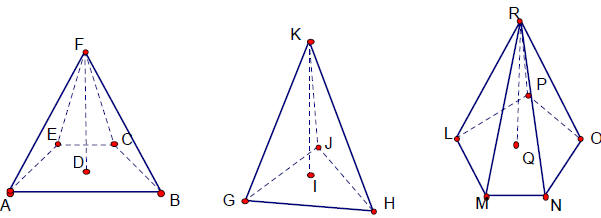
1. The volume of a pyramid is found using the formula Volume =
![]() ,
,
where b = area of the base and h = height of the pyramid. Consider the
value of h is constant . Bases of pyramids are plane figures; for example,
triangles, quadrilaterals, or pentagons. Consider the following figures and
find the formula for the volume of the pyramid.
2. North Car Sales traditionally sells fewer cars in the
months of January,
February, and March. This year they will try several initiatives to sell
more cars. In January, they will offer a rebate of $2000 on every car
sold. In February, the price of every car will be reduced by 5%. In
March, to really get things going they will offer both the deals of
January and February.
a. For January and February, write a function to determine the
discounted cost of a car where C = the original cost of the car
before discount. Use function notation to write these functions
where January is represented by J (C) and February is
represented by F(C) .
b. Determine whether to buy in January or February if the costs
of the cars are between $5000 and $50,000.
c. When the two deals are combined in March, there are two
possible function compositions. Find the two possible functions
for the discounted price in March.
d. Which gives the best deal of the two compositions? Explain.
e. Would you wait to buy a car in March rather than January or
February? Why?
3. A survey is given to students in which the student
states the average
number of hours per week they study and the number of honors-level or AP
courses they take. The average value for each course load is shown in the
table.
| Honors/AP Courses |
0 | 1 | 2 | 3 | 4 | 5 | 6 |
| Hours of Study each week |
5 | 7 | 11 | 14 | 17 | 21 | 25 |
a) Determine the independent and dependent variables .
b) Using data analysis methods , find a linear equation that will serve as a
good model for this information. Superimpose this function over the
scatter plot of the data .
c) Interpret the meaning of the slope of the line in the context of this
problem.
d) Suppose a student uses his or her study habits to determine the number
of honors-level or AP courses to take. What would be the independent
variable? Using the concept of the inverse of a function, find the
equation of the inverse of the linear function found above. Interpret the
slope of this line.
e) Graph both functions on the same coordinate system . Discuss how to
select an appropriate graphing window. Discuss domain and range for
each function.
f) If Frank knows he has only 15 hours per week to put toward his studies,
determine the number of honors-level or AP courses he should take,
according to this model. Discuss your method.
1. You can see a greater distance from a higher building. A function that
describes
the distance one can see from a tall building on a clear day is D(h) =![]() where
where
h = height in feet and D =distance you can see in miles.
a) The Eiffel Tower is 986 feet tall. How far would you
expect to see on a clear
day?
b) The Empire State Building is 1250 feet tall. How far would you expect to see
on
a clear day?
c) The Petronas Towers in Malyasia are 1483 feet tall. How far would you expect
to see on a clear day?
d) Pollution cuts visibility. Assume that visibility cuts the distance that can
be
seen to 35% of the distance seen on a clear day. Write a function that
describes distance on a cloudy day (C) when given the distance that can be seen
on a clear day (D).
e) Determine the number miles that can be seen from the three skyscrapers listed
in parts a, b, and c.
f) Write a function that describes the distance that can be seen on a cloudy day
as a function of the height of the building. Explain the composition of
functions.
2.
| speed of car (mph) | 0 | 22 | 33 | 44 | 55 |
| braking distance (ft) | 0 | 19 | 43 | 79 | 128 |
a) Develop a mathematical model that allows us to predict
braking distance given
the speed of the car. (This data is extracted from a graph found on page 288 of
the Glencoe
Algebra 2 textbook.)
b) Usually when there is a wreck police investigators are attempting to
determine
the speed of the driver. To do this, the investigators measure the length of
the skid marks left on the pavement. This means the ordered pairs will be
(braking distance, speed). How could we use the model from part a to create
another function that will allow you to predict the speed of the driver given
the
length of the skid marks?
[Hint: Simplify the model found in part a to include only the quadratic term
assuming the other two terms (linear and constant) are so small that they do not
affect the final outcome.]
| Prev | Next |