Overview
|
 |
In this lesson, you will review how
to graph linear equations on a
Cartesian coordinate system . You will also find the x- and y-intercepts,
the
slope of a line, and the distance between two points.
Finally, you will review how to write the equation of a line in three
forms:
point-slope form, standard form, and slope- intercept form . |
Explain
|
Concept 1 has sections on
• The Cartesian Coordinate
System
• The Distance Formula
• Graphing a Linear Equation
• Finding x- and y-intercepts
• Horizontal and Vertical
Lines
• The Slope of a Line
 |
CONCEPT 1:
GRAPHING LINESThe Cartesian
Coordinate System
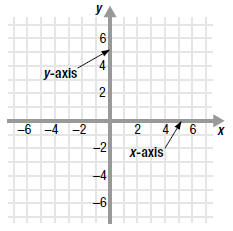
The Cartesian coordinate system consists of two real number lines
placed at right angles to each other.
The horizontal number line is called the x-axis.
The vertical number line is called the y-axis.
The axes define a flat surface called the xy-plane.
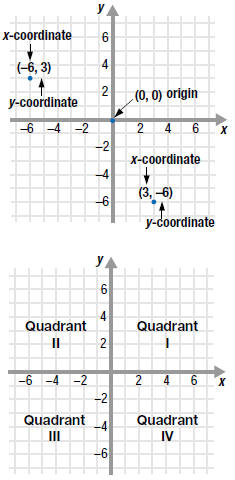
Every point in the xy-plane has two numbers associated with it.
• The x-coordinate or abscissa tells how far the point lies to the left
or
right of the y-axis.
• The y-coordinate or ordinate tells how far the point lies above or
below
the x-axis.
The x-coordinate and the y-coordinate are often written inside
parentheses ,
like this: (x, y).
The first number, x, represents the x-coordinate and the second number,
y, represents the y-coordinate.
For example, the point that is 3 units to the
right of the y-axis and 6 units
below the x-axis is labeled (3, -6).
Because the order in which the pair of numbers is written is important,
(x, y) is called an ordered pair. Thus, the point ( -6, 3) is not the
same as
the point (3, -6).
The x-axis and the y-axis intersect at the point (0, 0). This point is
called
the origin.
The x-axis and the y-axis divide the xy -plane into four regions called
quadrants.
| Quadrant |
Sign of x |
Sign of y |
| I |
positive |
positive |
| II |
negative |
positive |
| III |
negative |
negative |
| IV |
positive |
negative |
A point on an axis does not lie in a quadrant. |
| |
Example EII.E.1
Find the coordinates of each point
labeled on the graph.
Then, state the quadrant in which
each point lies.
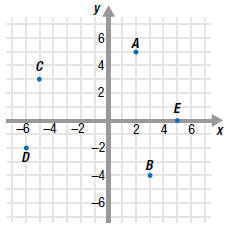
Solution
Point A has coordinates (2, 5), and lies in Quadrant I.
Point B has coordinates (3, -4), and lies in Quadrant IV.
Point C has coordinates ( -5, 3), and lies in Quadrant II.
Point D has coordinates ( -6, -2), and lies in Quadrant III.
Point E has coordinates (5, 0). It is not in a quadrant since it lies on
the
x-axis. |
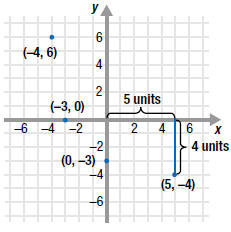
| Example EII.E.2
Plot each point on a Cartesian coordinate system:

Solution
The plot the point (5, -4), start at the origin:
• move 5 units to the right;
• then move down 4 units;
• place a dot at this location.
Follow a similar procedure for the other points. Notice the difference
between the locations of points ( -3, 0) and (0, -3). |
 |
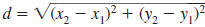
The Distance Formula
The distance between any two points in the xy-plane can be found using
the distance formula.
— Formula —
The Distance FormulaLet (x1,
y1) and (x2, y2) represent any
two points in the xy-plane. The
distance, d, between the points is given by
If the points lie on a horizontal line,
then this simplifies to

If the points lie on a vertical line, then
this simplifies to
 |
|
In the distance formula, it doesn’t
matter
which point is considered (x1, y1) or (x2,
y2).
The resulting distance is the same. |
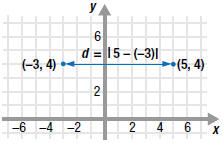
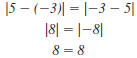
| Example EII.E.3
Find the distance between ( -3, 4) and (5, 4).
Solution
Since the points ( -3, 4) and (5, 4) have the same
y-coordinate, 4, they lie on a horizontal line. So,
|
we use the formula: |
 |
| Let x1 =-3 and x2
=5. |
 |
| Simplify. |
 |
| Find the absolute value. |
 |
The distance between ( -3, 4) and (5, 4) is 8
units |
In the formula, ,
it doesn’t
matter which x-coordinate is assigned to
x1 and which is assigned to x2. The
resulting distance is the same.
That is:
|
If we switch the points and let
 and and
 , we get the , we get the
same answer.We can use a calculator to
approximate  |
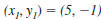
Example EII.E.4
Find the distance between ( -3, 8) and (5, -1).
Solution
The points do not lie on a horizontal or vertical line
| Therefore, use the distance formula. |
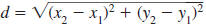 |
| Let
and
. |
 |
| Substitute. |
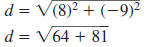 |
| Simplify. |
 |
The distance between the points ( -3, 8) and (5,
-1) is  units. units. |
Since two points determine a line,
you can
use any two points that satisfy the equation
to draw the line. Plotting more than two
points will help avoid errors. |
Graphing a Linear Equation
An equation that can be written in the form
 is called a
linear is called a
linear
equation because its graph is a straight line.
Here are some examples:
 |
| |
|
(Here, A 0.) |
(Here, B 0.) |
We can graph a linear equation on a Cartesian
coordinate system by
plotting points that satisfy the equation.
— Procedure —
To Graph a Linear Equation
Step 1 Make a table of ordered pairs that satisfy the
equation.
Step 2 Plot the ordered pairs.
Step 3 Draw a line through the plotted points. |
|
Here’s how to calculate the
corresponding
value for y when x = -3.
Equation. 
Replace x with -3. 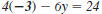
Multiply. 
Add 12 to both sides. 
Divide both sides by -6.
 |
Example EII.E.5
Graph the linear equation
 . .
Solution
Step 1 Make a table of ordered pairs that satisfy the equation.
Select values for x and then use
 to calculate the to calculate the
corresponding values for y.
Step 2 Plot the ordered pairs.
The points are shown on the graph.
Step 3 Draw a line through the plotted points.
Each point on the line represents a solution of the equation
|
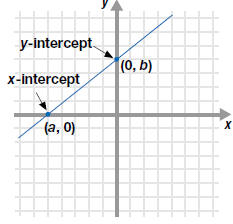
Finding x- and y-intercepts
The point where a graph crosses an axis called an intercept.
— Definition —
x-intercept and y-intercept |
The x-intercept is the point
where the line crosses the x-axis.
The x-intercept has the form
(a, 0), where a is a constant.
The y-intercept is the point
where the line crosses the y-axis.
The y-intercept has the form
(0, b), where b is a constant. |
 |
|
The x-intercept lies on the x-axis,
so y= 0.
The y-intercept lies on the y-axis, so x= 0. |
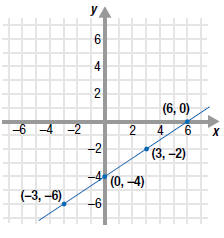
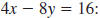
| Example EII.E.6
Given the equation
a. Find the x-intercept.
b. Find the y-intercept.
c. Use the intercepts to graph the line.
Solution
| a. The x-intercept has the form (a, 0). |
 |
| To find the x-intercept, substitute 0 for
y. |
 |
| Then, solve for x . |
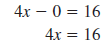 |
| The x-intercept is (4, 0). |
 |
| |
| b. The y-intercept has the form (0, b). |
 |
| To find the y-intercept, substitute 0 for
x. |
 |
| Then, solve for y. |
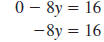 |
| The y-intercept is (0, -2). |
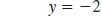 |
| |
c. To graph the line
,
first plot
the x- and y-intercepts.
| |
x |
y |
|
| Then, draw a line through the
intercepts. |
4 |
0 |
←x-intercept |
| As a check, it is a good idea to
find a third |
0 |
-2 |
←y-intercept |
| point on the line. |
-2 |
-3 |
←check point |
For example, let x = -2 in .
Then, solve for y.
The result is y = -3. So, the point ( -2, -3) should also lie on
the line. |
|
Two points that are
often easy to find are
the x- and y-intercepts. |
 |
 |
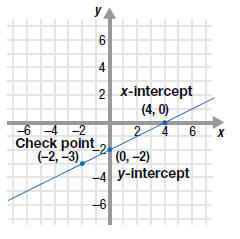
Horizontal and Vertical Lines
The graph of a linear equation,
, where A and
B are
not both 0, is a straight line.
• If A =0, then the graph is a horizontal line. For example, y= 3 is a
horizontal line. On this line, the y-coordinate is always 3.
• If B =0, then the graph is a vertical line. For example, x =5 is a
vertical line. On this line, the x-coordinate is always 5 |
 |
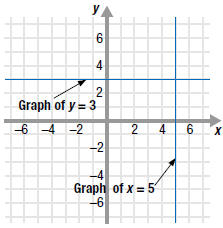
Example EII.E.7
Graph the following linear equations:
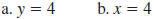
Solution
a. The graph of y 4 is a horizontal line.
On this line, the y-coordinate is always 4.
The y-intercept is (0, 4); the line has no x-intercept. |
|
b. The graph of x =4 is a vertical line.
On this line, the x-coordinate is always 4.
The x-intercept is (4, 0); the line has no y-intercept. |
|
|
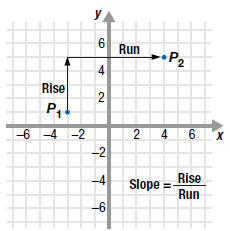 |
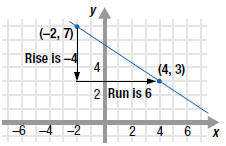
The Slope of a Line
The rise of a line represents the vertical change when moving from one
point to a second point on a line.
The run of a line represents the horizontal change when moving from one
point to a second point on the line.
The slope of a line is the ratio of the rise to the run.
It is a number that
describes the steepness of the line.
— Definition —
Slope of a Line
The slope of the line that passes through two points, (x1,
y1) and
(x2, y2), is given by
slope
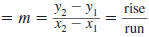
where  |
|
| Example EII.E.8
Find the slope of the line that passes through the
points (-2, 7) and (4, 3).
Solution
Let 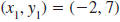 and
and
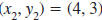 . . |
 |
| Substitute these values in the slope
formula. |
 |
| Simplify. |
 |
| Reduce . |
 |
Thus, the slope of the line through ( -2, 7) and
(4, 3) is  . . |
When using the slope formula, it does not
matter which point we choose for (x1, y1)
and which we choose for(x2, y2). |
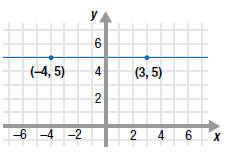
| Example EII.E.9
Find the slope of the line that passes through the
points ( -4, 5) and (3, 5).
Solution
Let 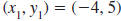 and
and
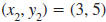 . . |
 |
| Substitute these values in the slope
formula. |
 |
| Simplify. |
 |
| Divide. |
 |
Thus, the slope of the line through ( -4, 5) and
(3, 5) is 0.
In fact, the slope of any horizontal line is 0. |
 |
| Example EII.E.10
Find the slope of the line that passes through the
points (3, 2) and (3, -4).
Solution
Let 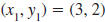 and
and
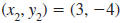 . . |
 |
| Substitute these values in the slope
formula. |
 |
| Simplify. |
 |
Since division by zero is undefined , the slope is
undefined.
In fact, the slope of any vertical line is undefined. |
 |
| |
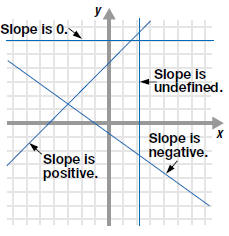
— Summary —
Slope of a Lin |
Slope is positive: Line slants
upward as we move from left to
right.
• Slope is negative : Line slants
downward as we move from left
to right.
• Slope is zero: The slope of a
horizontal line is 0.
• Slope is undefined: The slope
of a vertical line is undefined. |
 |
We can use slope to help us construct the graph of
a line. |
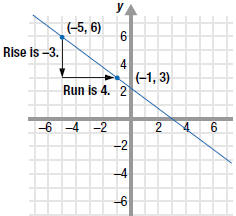 |
Example EII.E.11
Graph the line that passes through the point ( -5, 6)
with slope 
.
Solution
First, plot the given point, ( -5, 6).
To find another point on the line, use the slope. The slope,

,
tells us how to move up and down (rise) and left and right (run) to get
to
another point on the line. The slope 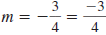 says
to move 3 units says
to move 3 units
down and 4 units right to get to another point, ( -1, 3).
Plot the point ( -1, 3).
Finally, draw a line through the two points. |
| |
Here is a summary of this concept
from Interactive Mathematics.
 |