Introduction to Linear Equations and Slope as a Constant Rate of Change through Data Collection
Introduction to Linear Equations and Slope as a Constant Rate of Change through Data Collection
7thgraders speak about linearity
•
Linear is a line on a graph that is straight and the changes in an experiment
are
the same each time. In an experiment, the same things happen each time, the
graphed information will be linear.
•
To me linear means a straight line that continues the same way in one
direction.
In a graph linear goes up the same amount each time and it never
changes . It
makes a diagonal line. Linear is important in graphing because it
shows if
something is the same.
•
Linear means a diagonal line going from one point on a coordinate grid to
another. We use it in math when we are graphing points in a coordinate grid
and
each point is the same distance away from another point on the grid.
•
Linear means a straight line graph that continues on the same pattern. I think
it shows how time and other information compare when they are different .
•
Linear means that it makes a straight line. Linear isn’t really that important
in
graphing because if you didn’t have linear, you could still make a graph.
•
Linear isn’t important to graphing because you use it to connect the points.
•
Linear is where lines are straight to each other. Graphing needs this because
without it there would be now way to make a point.
Application of linearity and graphing
•
Graphing the absorption flow of paper towels
•
Velocity versus acceleration
•
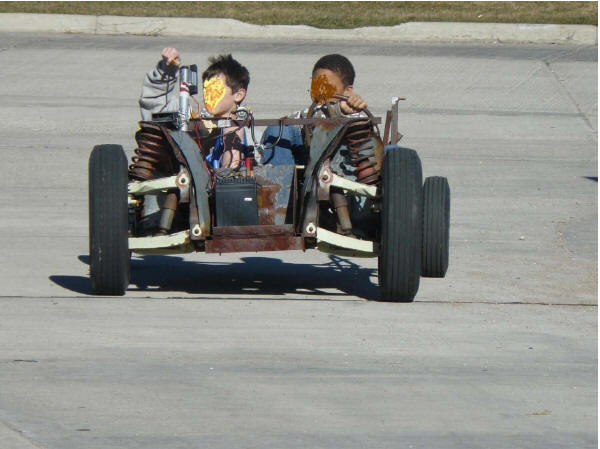
Voltage drop over time in an electric car
•
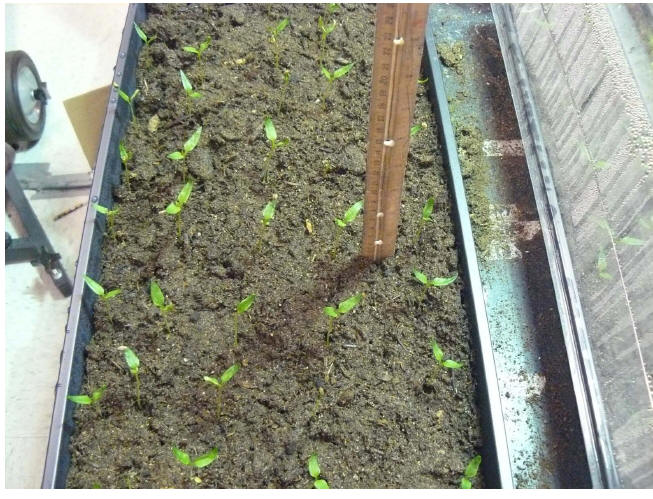
Plant growth over time
•
Inclined Plane Lab
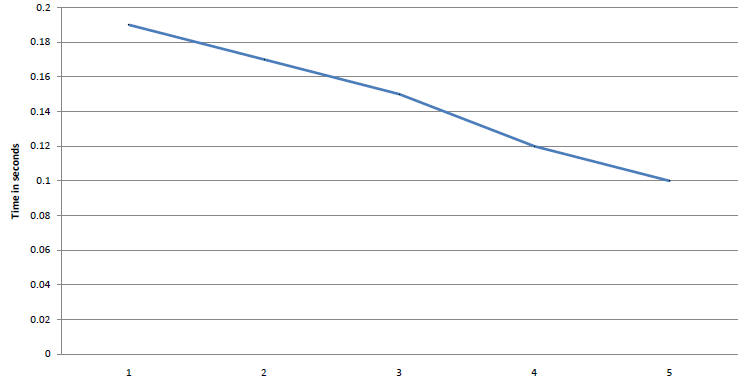
Boat Lab-Does added weight affect the boats speed?
Boat Lab/weight versus speed
Weights
Inclined Plane Lab
Inclined Plane Lab
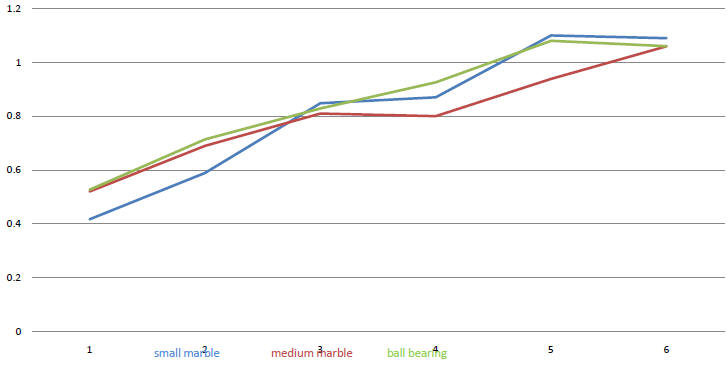
Velocity versus acceleration
acceleration versus velocity

time in seconds
Plant growth over time
Kidney bean growth after germination
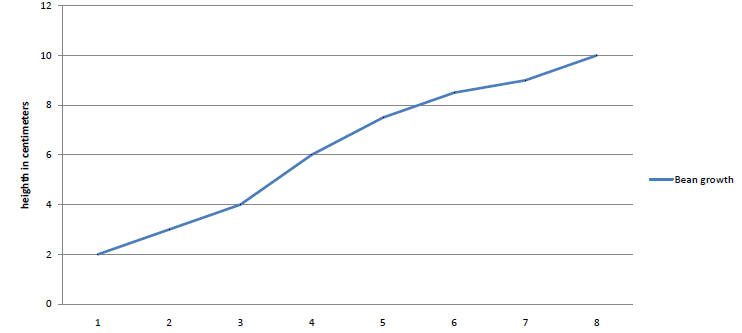
Day
Voltage drop over time in an electric car
Voltage drop over time (electric car)
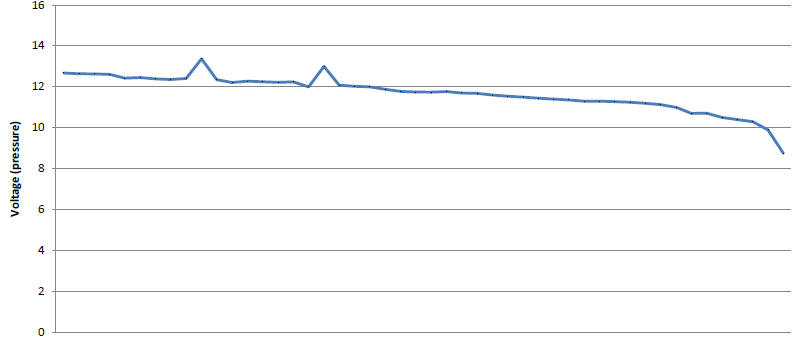
Laps (150 meters per lap)
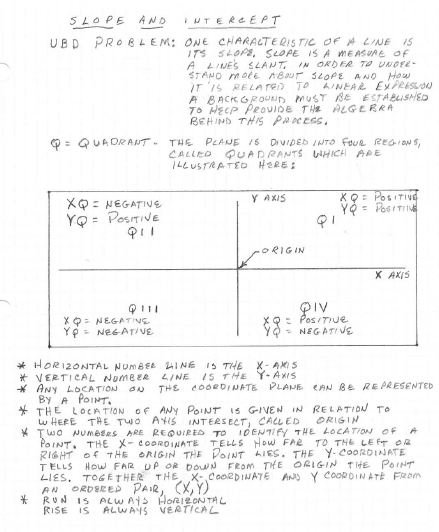 |
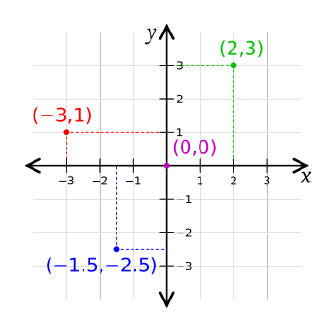
Slope
and Intercept |
 |
|
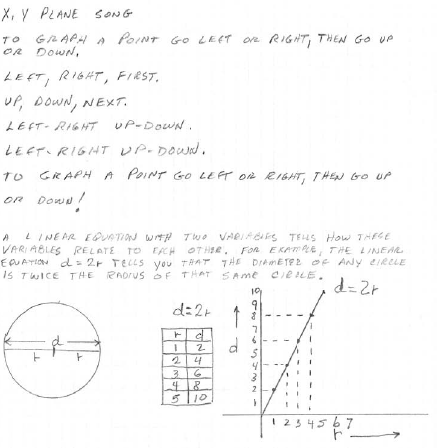 |
Examples
of linearity using a circle |
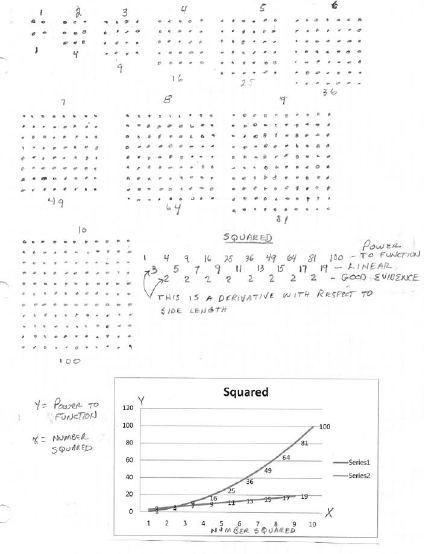 |
Having fun
with dots that turn into squares |
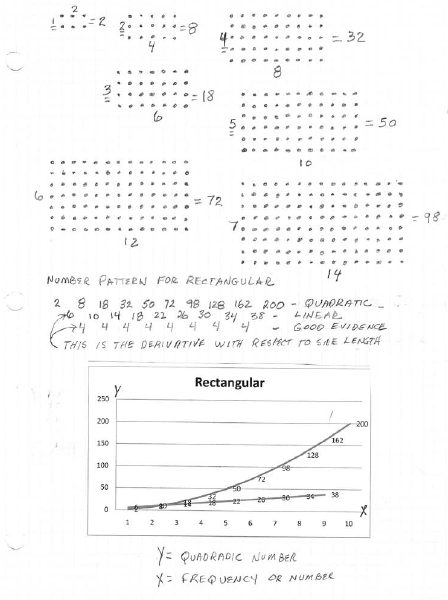 |
Looking at
rectangular data as it relates to linearity and quadratics |
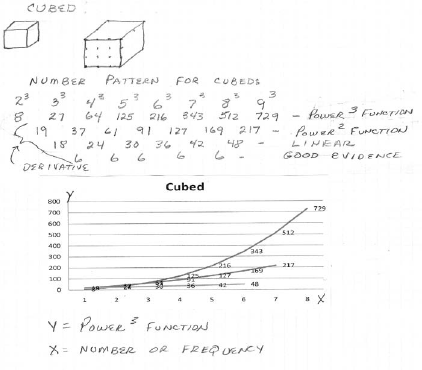 |
Cubed
patterns that are both linear and quadratic-A comparison |
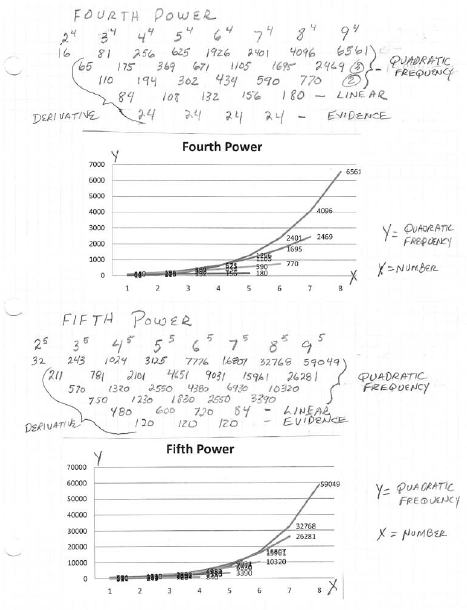 |
Looking at
fourth and fifth power patterns. What do you see? |
Electric car Lab
Growing Kidney Beans to learn graphing
| Prev | Next |