Grade 5 Math Content
Number and Operations :
Rational Numbers
The major focus of the work on rational numbers in grade 5 is on understanding
relationships among fractions, decimals, and percents. Students make comparisons
and
identify equivalent fractions, decimals, and percents, and they develop
strategies for
adding and subtracting fractions and decimals.
In a study of fractions and percents, students work with halves, thirds,
fourths, fifths,
sixths, eighths, tenths, and twelfths. They develop strategies for finding
percent
equivalents for these fractions so that they are able to move back and forth
easily between
fractions and percents and choose what is most helpful in solving a particular
problem,
such as finding percentages or fractions of a group.


Students use their knowledge of fraction equivalents, fraction-percent
equivalents, the
relationship of fractions to landmarks such as ½, 1, and 2, and other
relationships to
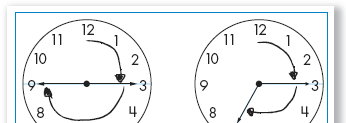
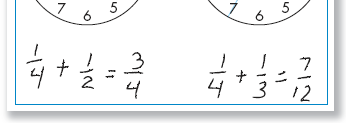
decide which of two fractions is greater. They carry out addition and
subtraction of
fractional amounts in ways that make sense to them by using representations such
as
rectangles, rotation on a clock, and the number line to visualize and reason
about fraction
equivalents and relationships.
Students continue to develop their understanding of how decimal fractions
represent
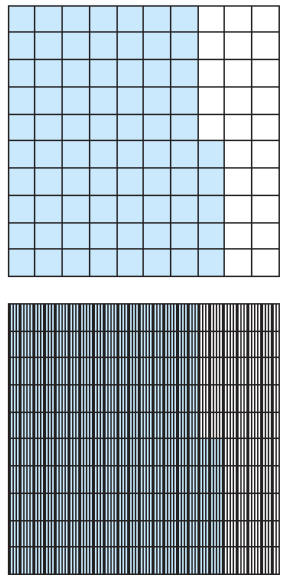
quantities less than 1 and extend their work with decimals to thousandths. By
representing tenths, hundredths, and thousandths on rectangular grids, students
learn
about the relationships among these numbers—for example, that one tenth is
equivalent
to ten hundredths and one hundredth is equivalent to ten thousandths—and how
these
numbers extend the place value structure of tens that they understand from their
work
with whole numbers.
Students extend their knowledge of fraction-decimal equivalents by studying how
fractions represent division and carrying out that division to find an
equivalent decimal.
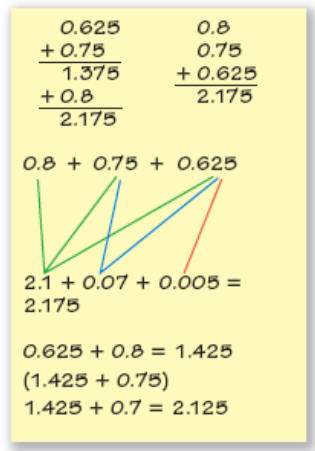
They compare, order, and add decimal fractions (tenths, hundredths, and
thousandths) by
carefully identifying the place value of the digits in each number and using
representations to visualize the quantities represented by these numbers.
Emphases
Rational Numbers
• Understanding the meaning of fractions and percents
• Comparing fractions
• Understanding the meaning of decimal fractions
• Comparing decimal fractions
Computation with Rational Numbers
• Adding and subtracting fractions
• Adding decimals
Benchmarks
• Use fraction-percent equivalents to solve problems about the percentage of a
quantity
• Order fractions with like and unlike denominators
• Add fractions through reasoning about fraction equivalents and relationships
• Read, write, and interpret decimal fractions to thousandths
• Order decimals to the thousandths
• Add decimal fractions through reasoning about place value, equivalents, and
representations
Patterns, Functions, and Change
In Grade 5, students continue their work from Grades 3 and 4 by examining,
representing, and describing situations in which the rate of change is constant .
Students
create tables and graphs to represent the relationship between two variables in
a variety of
contexts. They also articulate general rules for each situation. For example,
consider the
perimeters of the following set of rectangles made from rows of tiles with three
tiles in
each row:

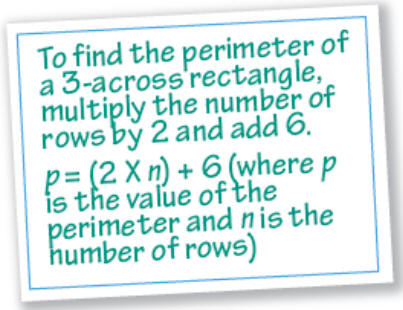
If the value of one variable (the number of rows of three tiles) is known, the
corresponding value of the other variable (the perimeter of the rectangle) can
be
calculated . Students express these rules in words and then in symbolic notation.
For
example:
For the first time in Grade 5, students create graphs for situations in which
the rate of
change is itself changing–for example, the change in the area of a square as a
side
increases by a constant increment–and consider why the shape of the graph is not
a
straight line as it is for situations with a constant rate of change.
Throughout their work, students move among tables, graphs, and equations and
between
those representations and the situation they represent. Their work with symbolic
notation
is closely related to the context in which they are working. By moving back and
forth
between the contexts, their own ways of describing general rules in words, and
symbolic
notation, students learn how this notation can carry mathematical meaning .
Emphases
Using Tables and Graphs
• Using graphs to represent change
• Using tables to represent change
Linear Change
• Describing and representing a constant rate of change
Number Sequences
• Describing and representing situations in which the rate of change is not
constant
Benchmarks
• Connect tables and graphs to represent the relationship between two variables
• Use tables and graphs to compare two situations with constant rates of change
• Use symbolic notation to represent the value of one variable in terms of
another
variable in situations with constant rates of change
Data Analysis and Probability
Students continue to develop their understanding of data analysis in Grade 5 by
collecting, representing, describing, and interpreting numerical data . Students’
work in
this unit focuses on comparing two sets of data collected from experiments.
Students
develop a question to compare two groups, objects, or conditions. (Sample
questions:
Which toy car goes farthest after rolling down the ramp? Which paper bridge
holds more
weight?). They consider how to ensure a consistent procedure for their
experiment and
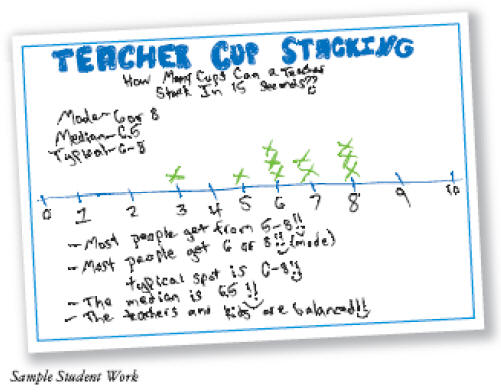
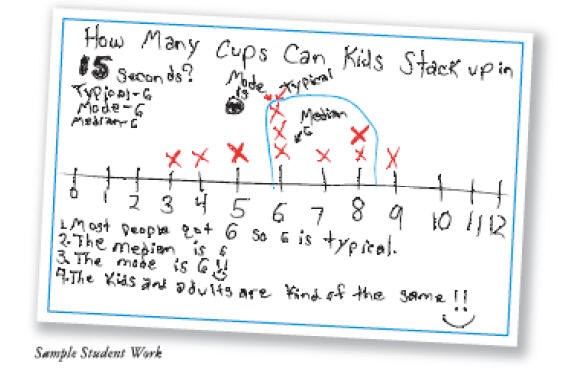
discuss the importance of multiple trials . Using representations of data,
including line
plots and bar graphs, students describe the shape of the data—where the data are
concentrated, how they are spread across the range. They summarize the data for
each
group or object or condition and use these summaries, including medians, to back
up their
conclusions and arguments. By carrying out a complete data investigation, from
formulating a question through drawing conclusions from their data, students
gain an
understanding of data analysis as a tool for learning about the world.
In their work with probability, students describe and predict the likelihood of
events and
compare theoretical probabilities with actual outcomes of many trials. They use
fractions
to express the probabilities of the possible outcomes (e.g., landing on the
green part of the
spinner, landing on the white part of the spinner). Then they conduct
experiments to see
what actually occurs. The experiments lead to questions about theoretical and
experimental probability, for example, if half the area of a spinner is colored
green and
half is colored white, why doesn’t the spinner land on green exactly half the
time?
Emphases
Data Analysis
• Representing data
• Describing, summarizing, and comparing data
• Analyzing and interpreting data
• Designing and carrying out a data investigation
Probability
• Describing the probability of an event
• Describe major features of a set of data represented in a line plot or bar
graph, and
quantify the description by using medians or fractional parts of the data
Benchmarks
• Draw conclusions about how 2 groups compare based on summarizing the data
for each group
• Design and carry out an experiment in order to compare two groups
• Use a decimal, fraction, or percent to describe and compare the theoretical
probabilities of events with a certain number of equally likely outcomes
Geometry and Measurement
In their work with geometry and measurement in grade 5, students further develop
their
understanding of the attributes of two-dimensional (2-D) shapes, find the
measure of
angles of polygons, determine the volume of three-dimensional (3-D) shapes, and
work
with area and perimeter. Students examine the characteristics of polygons,
including a
variety of triangles, quadrilaterals, and regular polygons. They consider
questions about
the classification of geometric figures, for example:
Are all squares rectangles?
Are all rectangles parallelograms?
If all squares are rhombuses, then are all rhombuses squares?


They investigate angle sizes in a set of polygons and measure angles of 30, 45,
60, 90,
120, and 150 degrees by comparing the angles of these shapes. Students also
investigate
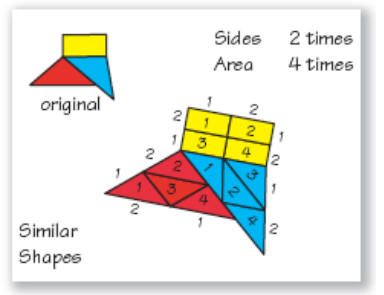
perimeter and area. They consider how changes to the shape of a rectangle can
affect one
of the measures and not the other (e.g., two shapes that have the same area
don’t
necessarily have the same perimeter), and examine the relationship between area
and
perimeter in similar figures.
Students continue to develop their visualization skills and their understanding
of the
relationship between 2-D pictures and the 3-D objects they represent. Students
determine
the volume of boxes (rectangular prisms) made from 2-D patterns and create
patterns for
boxes to hold a certain number of cubes. They develop strategies for determining
the
number of cubes in 3-D arrays by mentally organizing the cubes—for example as a
stack
of three rectangular layers, each three by four cubes. Students deepen their
understanding
of the relationship between volume and the linear dimensions of length, width,
and
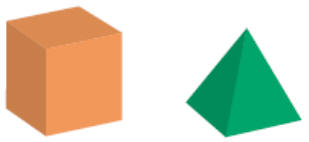
height. Once students have developed viable strategies for finding the volume of
rectangular prisms, they extend their understanding of volume to other solids
such as
pyramids, cylinders, and cones, measured in cubic units.
Emphases
Features of Shape
• Describing and classifying 2-D figures
• Describing and measuring angles
• Creating and describing similar shapes
• Translating between 2-D and 3-D shapes
Linear and Area Measurement
• Finding the perimeter and area of rectangles
Volume
• Structuring rectangular prisms and determining their volume
• Structuring prisms, pyramids, cylinders, and cones and determining their
volume
Benchmarks
• Identify different quadrilaterals by attribute, and know that some
quadrilaterals
can be classified in more than one way
• Use known angle sizes to determine the sizes of other angles (30 degrees, 45
degrees, 60 degrees, 90 degrees, 120 degrees, and 150 degrees)
• Determine the perimeter and area of rectangles
• Identify mathematically similar polygons
• Find the volume of rectangular prisms
• Use standard units to measure volume
• Identify how the dimensions of a box change when the volume is changed
• Explain the relationship between the volumes of prisms and pyramids with the
same base and height
| Prev | Next |