MATH 1314 Schedule
Business Math I
1 Least Squares Fit
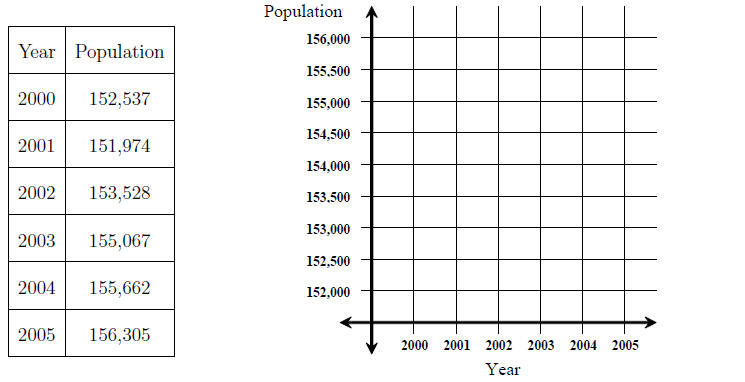
Example 1. Consider the following table of data showing the population in
Brazos County
between 2000 and 2005. Plot the data (approximately) on the given coordinate
system .

The graph of the points is called a scatter diagram or scatter plot.
Question: Is the relationship linear?
We would like to find the line that "best fits" the data.
The line that best fits
the data is
the line that minimizes the sum of the squares of the distances between the
y-value in the
data and the corresponding y-value on the line. This line is called the
least-squares line.
We can find the least-squares line using the calculator. It will also tell us
whether the line
fits the data well. Here's how:
Step 0: Go to CATALOG and scroll to DiagnosticOn. Press enter.
Step 1: Go to the STAT menu and select entry 4 (ClrList). Enter L1,L2.
Step 2: Press STAT and select entry 1 (EDIT). Place the x-values in L1 and the
corresponding y-values in L2.
Step 3: Press STAT and select CALC menu (to the right). Choose item 4 (LinReg(ax+b).
This gives you the slope (a) and the y- intercept (b). The r value is the
correlation
coefficient- it tells us how well the line fits the data. If r is close to 1 or -1,
the fit is
good. If r is close to 0, then the fit is bad.
To graph the points, we can use STAT PLOT. To graph the line, we can enter it into Y =.
Example 2. Answer the following questions using the data from Example 1.
1. What is the equation for the least squares line for the data?
2. According to the least squares line, what is the population of Brazos County in 2000?
3. Estimate the population of Brazos County in 2010.
2 Systems of Linear Equations
Example 3. A truck rental company plans to spend 6
million dollars on 200 new vehicles.
Each van costs 20,000 dollars, each small truck costs 30,000 dollars, and each
large truck
costs 50,000 dollars. Past experience tells them that they will need twice as
many vans as
small trucks. How many of each kind of vehicle should they buy? (We will find
the answer
to this question later in these notes.)
Set up a system of equations to describe this word problem:
This is called a system of linear equations. The above
system has 3 equations and 3
variables.
Definition 1. A linear equation in n variables x1, x2, …xn is one of the form

where at least one of the a's is not zero, and the a's and c are all constants.
For example:

are both linear equations.
Definition 2. A system of M linear equations in
N variables is a list of M equations
which have exactly N different variables occurring in them.
Definition 3. A solution to a system of
linear equations is a set of values for the variables
which satisfy each equation in the system.
Consider systems with 2 equations and 2 variables. These
can be represented by 2 lines,
where intersection points are solutions to the system . There are three
possibilities:
Exactly one solution:
No solutions: (System is inconsistent.)
Infinitely many solutions: (System is dependent - involves a parameter.)
3 Gauss-Jordan!
The Gauss-Jordan elimination method allows us to
solve systems of linear equations by
replacing a system with an equivalent system that is simpler to read.
There are three allowed operations:
1. Interchange any two equations .
2. Multiply any equation by a nonzero number .
3. Replace an equation with: the equation + a multiple of a different equation.
Example 4. Apply Gauss-Jordan to the following pair of equations:

One useful and common way to store the coefficients is to
use matrices. The above system
has the following coefficient and augmented matrices:
In matrix form, Gauss-Jordan elimination involves the
following row operations:
1. Interchange any two rows.
2. Multiply any row by a nonzero number.
3. Replace a row with: the row + a multiple of a different row.
In Gauss-Jordan elimination, to pivot about an element
means to use row operations to
make the entries above and below the element 0.
Example 5. Pivot the following augmented matrix about the element 3.

When solving a system of linear equations in matrix form,
our goal is to find a Row-
Reduced form of the matrix. This form has the following properties:
1. The first nonzero entry in a row is a 1. (This is
called a leading 1.)
2. If a column contains a leading 1, then all other entries in that column are
0.
3. The rows are ordered as follows:
(a) Each row that consists entirely of zeros lies below any row with a non-zero
entry.
(b) In any two non-zero rows, the leading 1 in the lower row lies to the right
of the
leading 1 in the upper row.
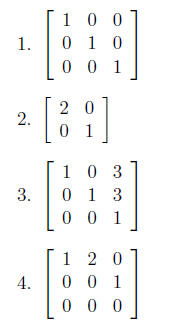
Example 6. Are the following matrices in
row-reduced form? If not, what row operations
would you perform to change the matrix into row-reduced form?

Once a matrix is in row-reduced form, you can change it
back to equation form, and solve
the system easily.
We can use the calculator to perform Gauss-Jordan elimination:
We can now finish the initial example:
Example 3. A truck rental company plans to spend 6
million dollars on 200 new vehicles.
Each van costs 20,000 dollars, each small truck costs 30,000 dollars, and each
large truck
costs 50,000 dollars. Past experience tells them that they will need twice as
many vans as
small trucks. How many of each kind of vehicle can they buy?
(Note: Much of these notes are taken from Melanie Pivarski's notes for Math 141.)
| Prev | Next |